29
/it/
it
AIzaSyAYiBZKx7MnpbEhh9jyipgxe19OcubqV5w
April 1, 2024
164214
Japan
JPN
true
2
1
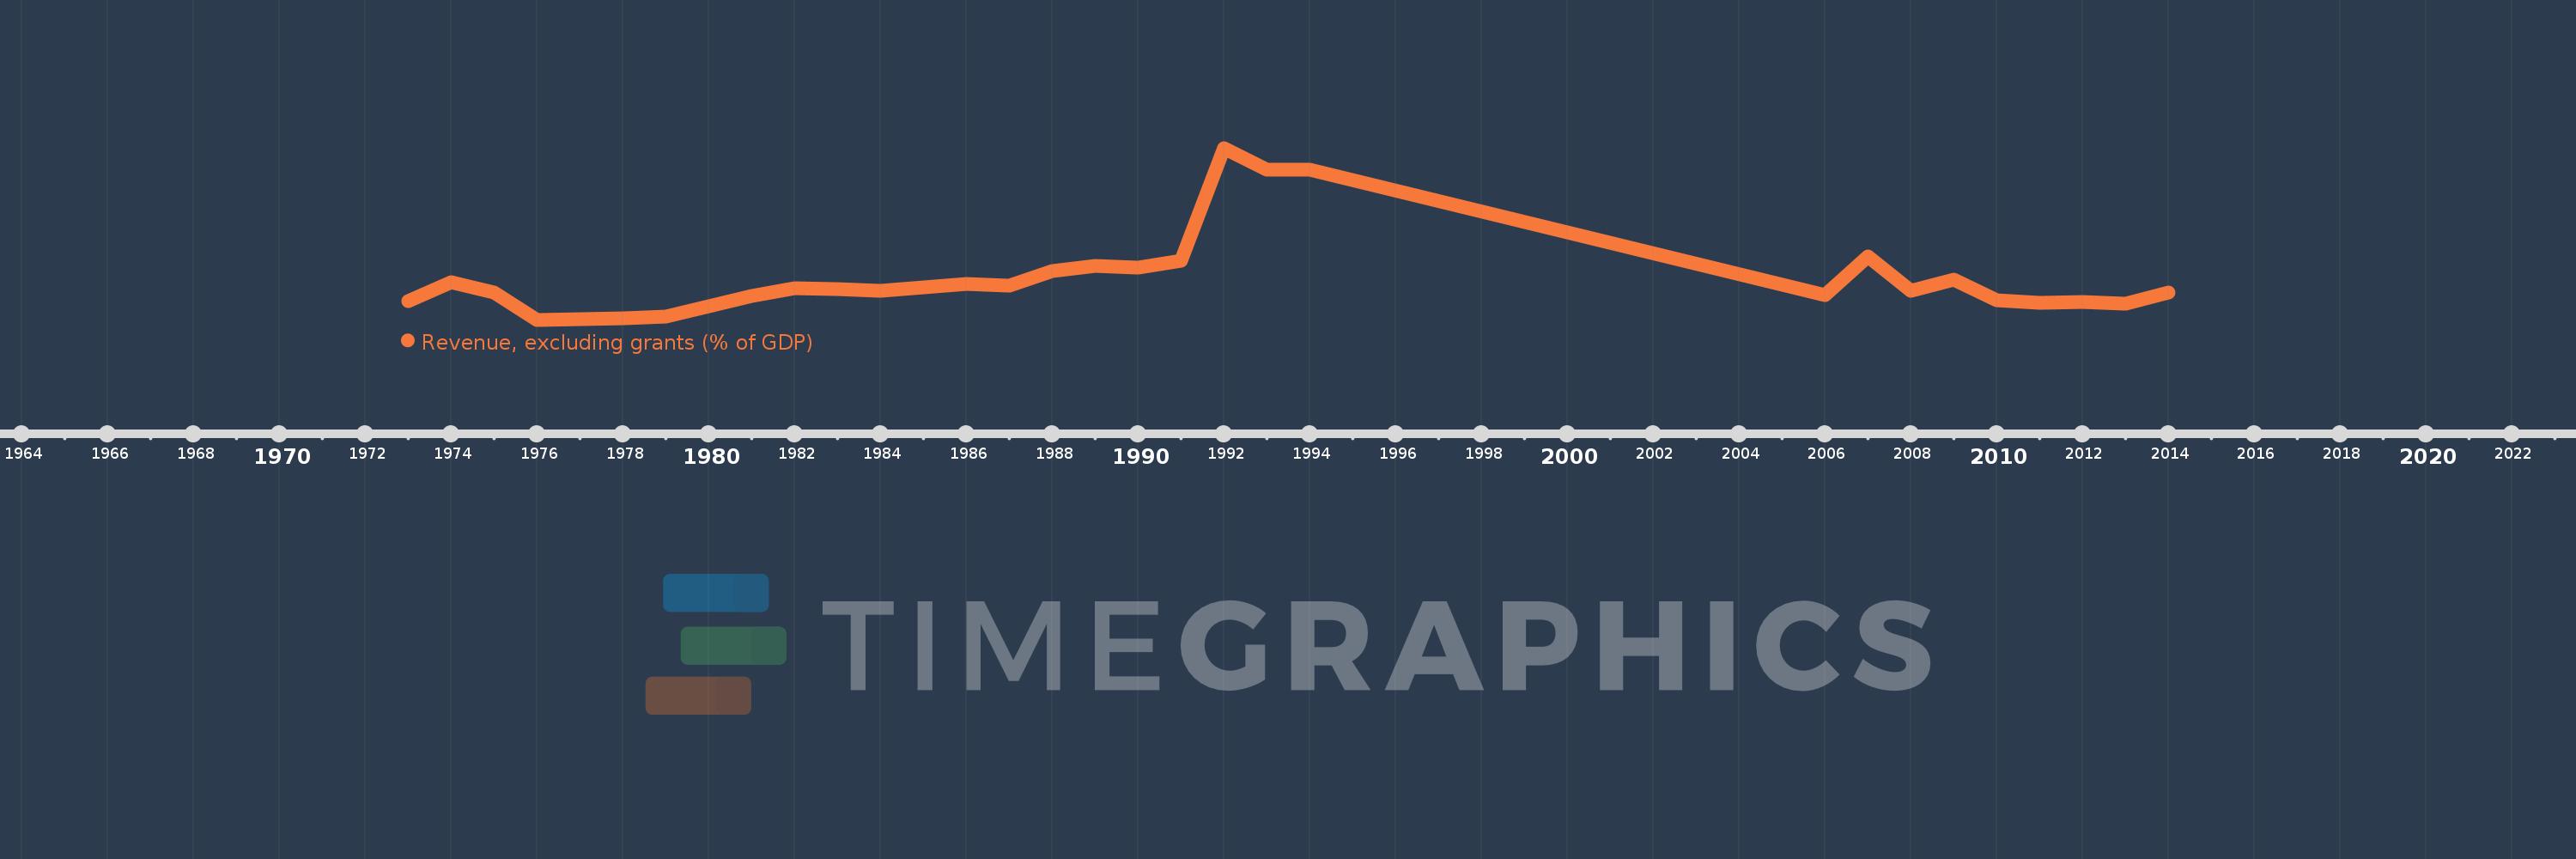
Revenue, excluding grants (% of GDP)
2014,2013,2012,2011,2010,2009,2008,2007,2006,1994,1993,1992,1991,1990,1989,1988,1987,1986,1985,1984,1983,1982,1981,1980,1979,1978,1977,1976,1975,1974,1973
Queste statistiche in altri paesi:
AfghanistanAlbaniaAlgeriaAngolaAntigua and BarbudaArgentinaArmeniaAustraliaAustriaAzerbaijanBahamas, TheBahrainBangladeshBarbadosBelarusBelgiumBelizeBeninBhutanBoliviaBosnia and HerzegovinaBotswanaBrazilBulgariaBurkina FasoBurundiCabo VerdeCambodiaCanadaCaribbean small statesCentral African RepublicCentral Europe and the BalticsChileChinaColombiaCongo, Dem. Rep.Congo, Rep.Costa RicaCote d'IvoireCroatiaCyprusCzech RepublicDenmarkDominicaDominican RepublicEarly-demographic dividendEast Asia & PacificEast Asia & Pacific (excluding high income)East Asia & Pacific (IDA & IBRD countries)Egypt, Arab Rep.El SalvadorEquatorial GuineaEstoniaEthiopiaEuro areaEurope & Central AsiaEurope & Central Asia (excluding high income)Europe & Central Asia (IDA & IBRD countries)European UnionFijiFinlandFranceGambia, TheGeorgiaGermanyGhanaGreeceGrenadaGuatemalaHeavily indebted poor countries (HIPC)High incomeHondurasHong Kong SAR, ChinaHungaryIBRD onlyIcelandIDA & IBRD totalIDA blendIDA onlyIDA totalIndiaIndonesiaIran, Islamic Rep.IraqIrelandIsraelItalyJamaicaJapanJordanKazakhstanKenyaKiribatiKorea, Rep.KuwaitKyrgyz RepublicLao PDRLate-demographic dividendLatin America & Caribbean Latin America & Caribbean (excluding high income)Latin America & the Caribbean (IDA & IBRD countries)LatviaLeast developed countries: UN classificationLebanonLesothoLiberiaLithuaniaLow & middle incomeLow incomeLower middle incomeLuxembourgMacao SAR, ChinaMacedonia, FYRMadagascarMalawiMalaysiaMaldivesMaliMaltaMauritiusMexicoMicronesia, Fed. Sts.Middle East & North Africa (excluding high income)Middle East & North Africa (IDA & IBRD countries)Middle incomeMoldovaMongoliaMoroccoMozambiqueMyanmarNamibiaNepalNetherlandsNew ZealandNicaraguaNigeriaNorth AmericaNorwayOECD membersOmanOther small statesPacific island small statesPakistanPanamaPapua New GuineaParaguayPeruPhilippinesPolandPortugalPost-demographic dividendPre-demographic dividendQatarRomaniaRussian FederationRwandaSamoaSan MarinoSao Tome and PrincipeSenegalSerbiaSeychellesSierra LeoneSingaporeSlovak RepublicSloveniaSmall statesSolomon IslandsSouth AfricaSouth AsiaSouth Asia (IDA & IBRD)SpainSri LankaSt. Kitts and NevisSt. LuciaSt. Vincent and the GrenadinesSub-Saharan Africa Sub-Saharan Africa (excluding high income)Sub-Saharan Africa (IDA & IBRD countries)SurinameSwazilandSwedenSwitzerlandSyrian Arab RepublicTajikistanTanzaniaThailandTimor-LesteTogoTrinidad and TobagoTunisiaTurkeyUgandaUkraineUnited Arab EmiratesUnited KingdomUnited StatesUpper middle incomeUruguayVanuatuVenezuela, RBVietnamWest Bank and GazaWorldYemen, Rep.ZambiaZimbabwe Linea del tempo:
Questa scala temporale mostra un grafico dal 1973 anno al 2014 anno. Japan. I dati fino ad 1972 anno non disponibili. Il numero di osservazioni attuali secondo i date: 31.
La fonte (nome):
Indicatori dello sviluppo mondiale
La fonte (organizzazione):
International Monetary Fund, Government Finance Statistics Yearbook and data files, and World Bank and OECD GDP estimates.
Categorie:
Economy & Growth, Public Sector
sono stati aggiornati
23 apr 2017 anni
Indicatori delle variazioni dei valori per anni
Minima:
9.59
1 gen 1976 anni
Massimo:
21.867
1 gen 1992 anni
Alla data di osservazione
Valore
Variazione assoluta
La variazione rispetto al valore precedente
1 gen 1973 anni
10.932
+10.932
0.0%
1 gen 1974 anni
12.252
+1.32
12.07%
1 gen 1975 anni
11.554
-0.698
-5.7%
1 gen 1976 anni
9.59
-1.964
-17.0%
1 gen 1977 anni
9.646
+0.056
0.59%
1 gen 1978 anni
9.679
+0.032
0.33%
1 gen 1979 anni
9.814
+0.135
1.4%
1 gen 1980 anni
10.584
+0.77
7.85%
1 gen 1981 anni
11.298
+0.714
6.75%
1 gen 1982 anni
11.849
+0.551
4.88%
1 gen 1983 anni
11.777
-0.072
-0.61%
1 gen 1984 anni
11.645
-0.132
-1.12%
1 gen 1985 anni
11.92
+0.275
2.36%
1 gen 1986 anni
12.143
+0.223
1.87%
1 gen 1987 anni
12.02
-0.123
-1.01%
1 gen 1988 anni
13.075
+1.055
8.77%
1 gen 1989 anni
13.438
+0.363
2.78%
1 gen 1990 anni
13.33
-0.108
-0.8%
1 gen 1991 anni
13.788
+0.457
3.43%
1 gen 1992 anni
21.867
+8.079
58.6%
1 gen 1993 anni
20.323
-1.544
-7.06%
1 gen 1994 anni
20.296
-0.027
-0.13%
1 gen 2006 anni
11.366
-8.93
-44.0%
1 gen 2007 anni
14.112
+2.746
24.16%
1 gen 2008 anni
11.662
-2.45
-17.36%
1 gen 2009 anni
12.446
+0.785
6.73%
1 gen 2010 anni
11.011
-1.436
-11.53%
1 gen 2011 anni
10.817
-0.193
-1.76%
1 gen 2012 anni
10.876
+0.058
0.54%
1 gen 2013 anni
10.745
-0.131
-1.21%
1 gen 2014 anni
11.53
+0.785
7.31%
Classificazione dei paesi secondo i statistiche attuali per anni


Commenti: