29
/it/
it
AIzaSyAYiBZKx7MnpbEhh9jyipgxe19OcubqV5w
April 1, 2024
240921
Singapore
SGP
true
2
1
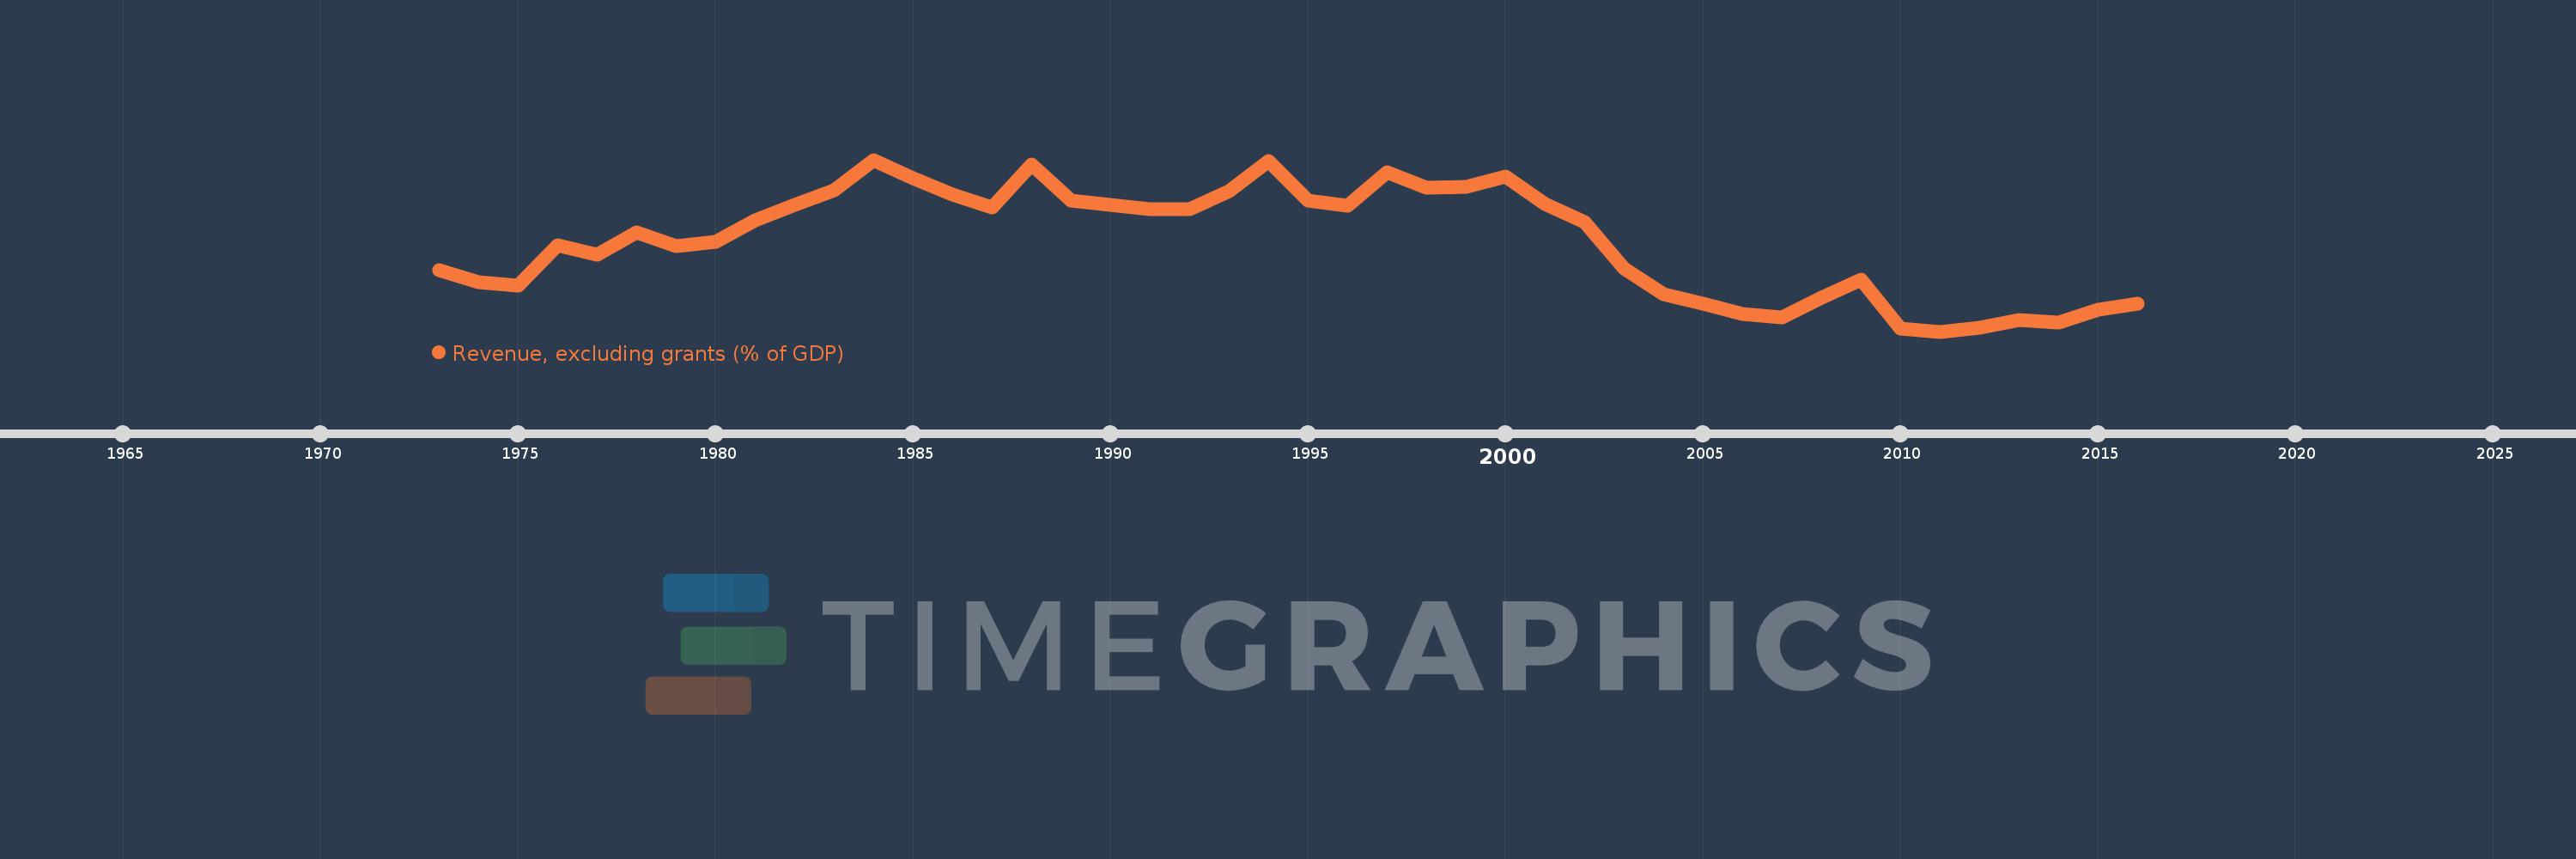
Revenue, excluding grants (% of GDP)
2016,2015,2014,2013,2012,2011,2010,2009,2008,2007,2006,2005,2004,2003,2002,2001,2000,1999,1998,1997,1996,1995,1994,1993,1992,1991,1990,1989,1988,1987,1986,1985,1984,1983,1982,1981,1980,1979,1978,1977,1976,1975,1974,1973
Queste statistiche in altri paesi:
AfghanistanAlbaniaAlgeriaAngolaAntigua and BarbudaArgentinaArmeniaAustraliaAustriaAzerbaijanBahamas, TheBahrainBangladeshBarbadosBelarusBelgiumBelizeBeninBhutanBoliviaBosnia and HerzegovinaBotswanaBrazilBulgariaBurkina FasoBurundiCabo VerdeCambodiaCanadaCaribbean small statesCentral African RepublicCentral Europe and the BalticsChileChinaColombiaCongo, Dem. Rep.Congo, Rep.Costa RicaCote d'IvoireCroatiaCyprusCzech RepublicDenmarkDominicaDominican RepublicEarly-demographic dividendEast Asia & PacificEast Asia & Pacific (excluding high income)East Asia & Pacific (IDA & IBRD countries)Egypt, Arab Rep.El SalvadorEquatorial GuineaEstoniaEthiopiaEuro areaEurope & Central AsiaEurope & Central Asia (excluding high income)Europe & Central Asia (IDA & IBRD countries)European UnionFijiFinlandFranceGambia, TheGeorgiaGermanyGhanaGreeceGrenadaGuatemalaHeavily indebted poor countries (HIPC)High incomeHondurasHong Kong SAR, ChinaHungaryIBRD onlyIcelandIDA & IBRD totalIDA blendIDA onlyIDA totalIndiaIndonesiaIran, Islamic Rep.IraqIrelandIsraelItalyJamaicaJapanJordanKazakhstanKenyaKiribatiKorea, Rep.KuwaitKyrgyz RepublicLao PDRLate-demographic dividendLatin America & Caribbean Latin America & Caribbean (excluding high income)Latin America & the Caribbean (IDA & IBRD countries)LatviaLeast developed countries: UN classificationLebanonLesothoLiberiaLithuaniaLow & middle incomeLow incomeLower middle incomeLuxembourgMacao SAR, ChinaMacedonia, FYRMadagascarMalawiMalaysiaMaldivesMaliMaltaMauritiusMexicoMicronesia, Fed. Sts.Middle East & North Africa (excluding high income)Middle East & North Africa (IDA & IBRD countries)Middle incomeMoldovaMongoliaMoroccoMozambiqueMyanmarNamibiaNepalNetherlandsNew ZealandNicaraguaNigeriaNorth AmericaNorwayOECD membersOmanOther small statesPacific island small statesPakistanPanamaPapua New GuineaParaguayPeruPhilippinesPolandPortugalPost-demographic dividendPre-demographic dividendQatarRomaniaRussian FederationRwandaSamoaSan MarinoSao Tome and PrincipeSenegalSerbiaSeychellesSierra LeoneSingaporeSlovak RepublicSloveniaSmall statesSolomon IslandsSouth AfricaSouth AsiaSouth Asia (IDA & IBRD)SpainSri LankaSt. Kitts and NevisSt. LuciaSt. Vincent and the GrenadinesSub-Saharan Africa Sub-Saharan Africa (excluding high income)Sub-Saharan Africa (IDA & IBRD countries)SurinameSwazilandSwedenSwitzerlandSyrian Arab RepublicTajikistanTanzaniaThailandTimor-LesteTogoTrinidad and TobagoTunisiaTurkeyUgandaUkraineUnited Arab EmiratesUnited KingdomUnited StatesUpper middle incomeUruguayVanuatuVenezuela, RBVietnamWest Bank and GazaWorldYemen, Rep.ZambiaZimbabwe Linea del tempo:
Questa scala temporale mostra un grafico dal 1973 anno al 2016 anno. Singapore. I dati fino ad 1972 anno non disponibili. Il numero di osservazioni attuali secondo i date: 44.
La fonte (nome):
Indicatori dello sviluppo mondiale
La fonte (organizzazione):
International Monetary Fund, Government Finance Statistics Yearbook and data files, and World Bank and OECD GDP estimates.
Categorie:
Economy & Growth, Public Sector
sono stati aggiornati
23 apr 2017 anni
Indicatori delle variazioni dei valori per anni
Minima:
17.019
1 gen 2011 anni
Massimo:
28.747
1 gen 1984 anni
Alla data di osservazione
Valore
Variazione assoluta
La variazione rispetto al valore precedente
1 gen 1973 anni
21.211
+21.211
0.0%
1 gen 1974 anni
20.416
-0.795
-3.75%
1 gen 1975 anni
20.18
-0.237
-1.16%
1 gen 1976 anni
22.917
+2.737
13.56%
1 gen 1977 anni
22.277
-0.639
-2.79%
1 gen 1978 anni
23.81
+1.532
6.88%
1 gen 1979 anni
22.881
-0.929
-3.9%
1 gen 1980 anni
23.122
+0.241
1.05%
1 gen 1981 anni
24.61
+1.488
6.44%
1 gen 1982 anni
25.695
+1.085
4.41%
1 gen 1983 anni
26.653
+0.958
3.73%
1 gen 1984 anni
28.747
+2.094
7.86%
1 gen 1985 anni
27.459
-1.288
-4.48%
1 gen 1986 anni
26.377
-1.082
-3.94%
1 gen 1987 anni
25.483
-0.893
-3.39%
1 gen 1988 anni
28.453
+2.97
11.66%
1 gen 1989 anni
25.967
-2.486
-8.74%
1 gen 1990 anni
25.66
-0.307
-1.18%
1 gen 1991 anni
25.348
-0.312
-1.22%
1 gen 1992 anni
25.356
+0.008
0.03%
1 gen 1993 anni
26.587
+1.231
4.85%
1 gen 1994 anni
28.671
+2.085
7.84%
1 gen 1995 anni
25.955
-2.717
-9.48%
1 gen 1996 anni
25.582
-0.373
-1.44%
1 gen 1997 anni
27.909
+2.327
9.09%
1 gen 1998 anni
26.817
-1.092
-3.91%
1 gen 1999 anni
26.919
+0.102
0.38%
1 gen 2000 anni
27.576
+0.658
2.44%
1 gen 2001 anni
25.746
-1.83
-6.64%
1 gen 2002 anni
24.487
-1.259
-4.89%
1 gen 2003 anni
21.321
-3.167
-12.93%
1 gen 2004 anni
19.554
-1.766
-8.28%
1 gen 2005 anni
18.921
-0.633
-3.24%
1 gen 2006 anni
18.231
-0.69
-3.65%
1 gen 2007 anni
17.998
-0.233
-1.28%
1 gen 2008 anni
19.353
+1.355
7.53%
1 gen 2009 anni
20.562
+1.209
6.25%
1 gen 2010 anni
17.209
-3.353
-16.31%
1 gen 2011 anni
17.019
-0.19
-1.1%
1 gen 2012 anni
17.276
+0.257
1.51%
1 gen 2013 anni
17.828
+0.552
3.19%
1 gen 2014 anni
17.658
-0.17
-0.96%
1 gen 2015 anni
18.521
+0.863
4.89%
1 gen 2016 anni
18.936
+0.414
2.24%
Classificazione dei paesi secondo i statistiche attuali per anni


Commenti: