29
/it/
it
AIzaSyAYiBZKx7MnpbEhh9jyipgxe19OcubqV5w
April 1, 2024
50327
Middle East & North Africa (IDA & IBRD countries)
TMN
false
2
1
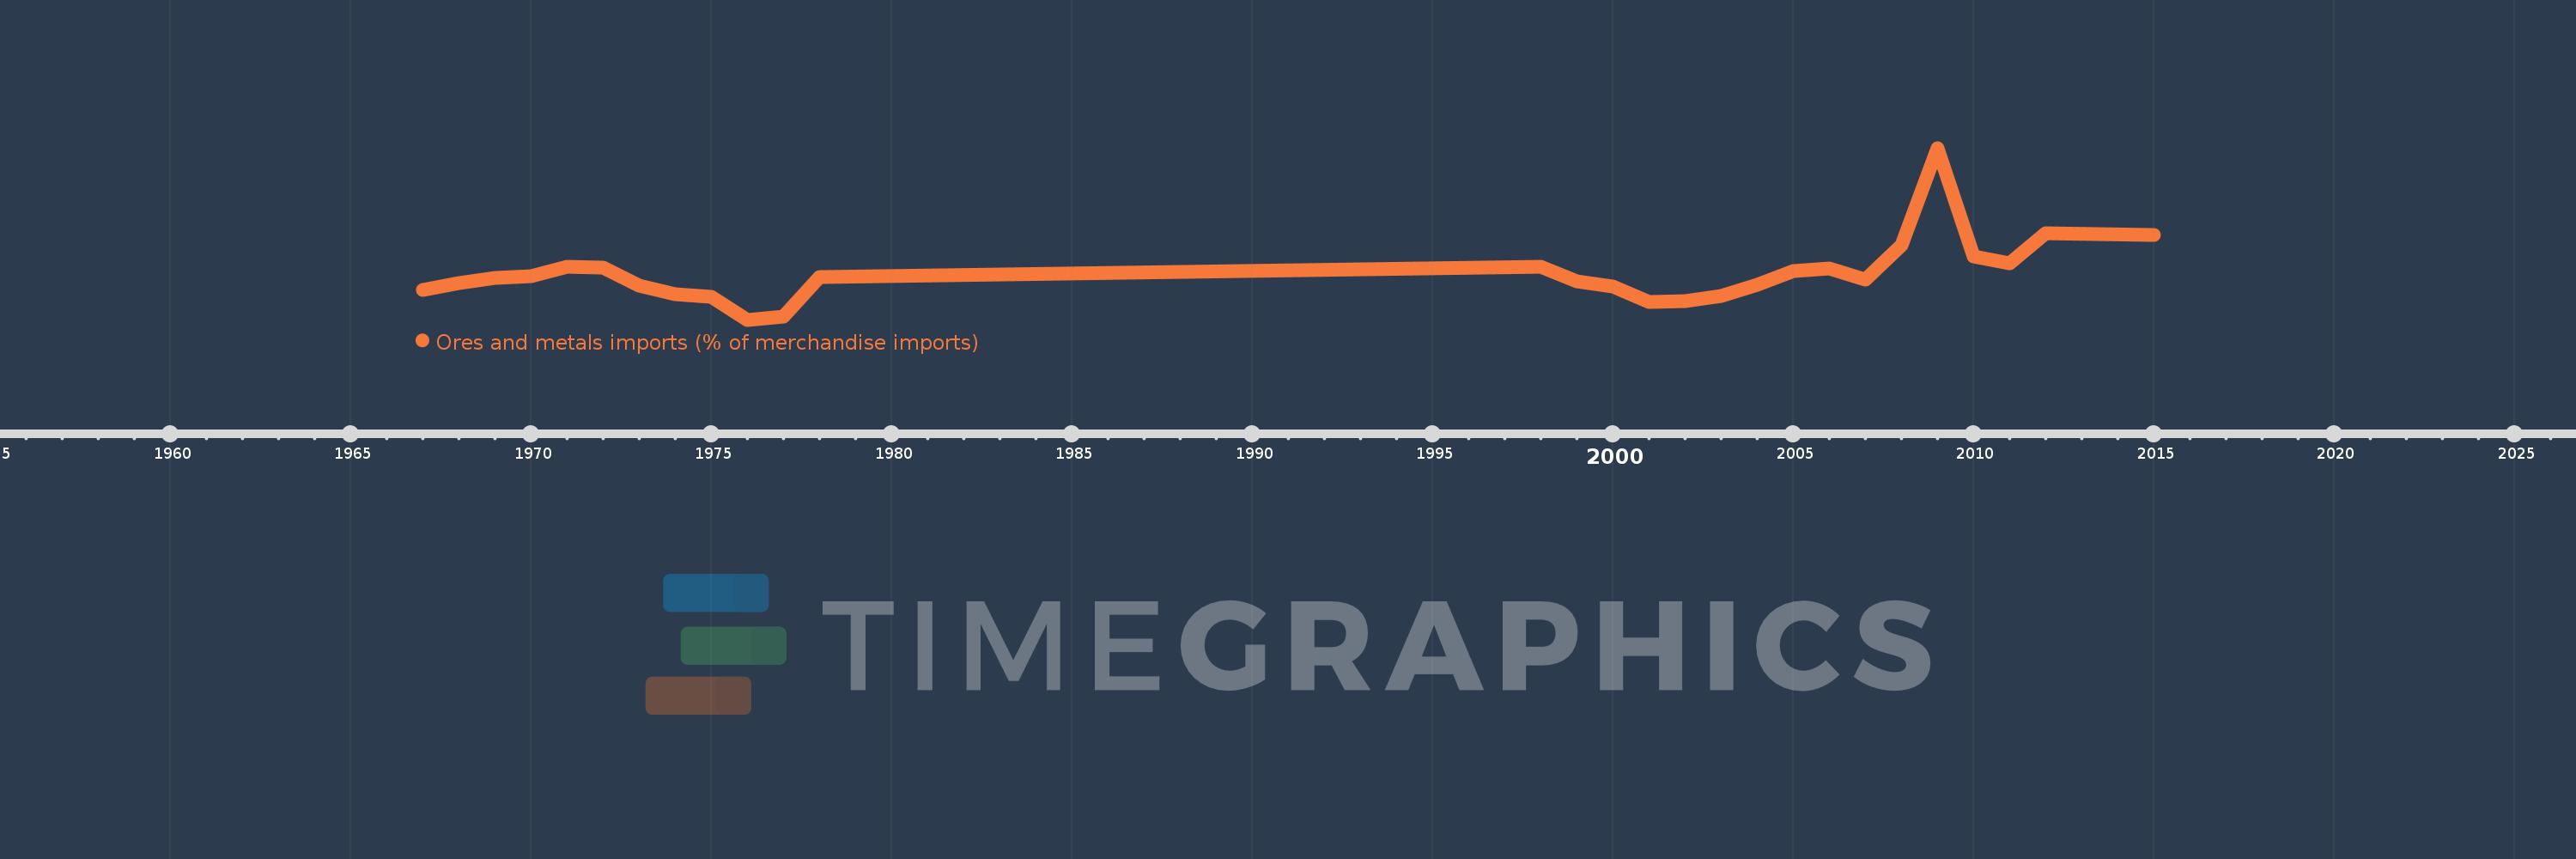
Ores and metals imports (% of merchandise imports)
2015,2012,2011,2010,2009,2008,2007,2006,2005,2004,2003,2002,2001,2000,1999,1998,1978,1977,1976,1975,1974,1973,1972,1971,1970,1969,1968,1967
Queste statistiche in altri paesi:
AfghanistanAlbaniaAlgeriaAndorraAngolaAntigua and BarbudaArab WorldArgentinaArmeniaArubaAustraliaAustriaAzerbaijanBahamas, TheBahrainBangladeshBarbadosBelarusBelgiumBelizeBeninBermudaBhutanBoliviaBosnia and HerzegovinaBotswanaBrazilBrunei DarussalamBulgariaBurkina FasoBurundiCabo VerdeCambodiaCameroonCanadaCaribbean small statesCayman IslandsCentral African RepublicCentral Europe and the BalticsChadChileChinaColombiaComorosCongo, Dem. Rep.Congo, Rep.Costa RicaCote d'IvoireCroatiaCubaCyprusCzech RepublicDenmarkDjiboutiDominicaDominican RepublicEarly-demographic dividendEast Asia & PacificEast Asia & Pacific (excluding high income)East Asia & Pacific (IDA & IBRD countries)EcuadorEgypt, Arab Rep.El SalvadorEquatorial GuineaEritreaEstoniaEthiopiaEuro areaEurope & Central AsiaEurope & Central Asia (excluding high income)Europe & Central Asia (IDA & IBRD countries)European UnionFaroe IslandsFijiFinlandFragile and conflict affected situationsFranceFrench PolynesiaGabonGambia, TheGeorgiaGermanyGhanaGreeceGreenlandGrenadaGuatemalaGuineaGuinea-BissauGuyanaHaitiHeavily indebted poor countries (HIPC)High incomeHondurasHong Kong SAR, ChinaHungaryIBRD onlyIcelandIDA & IBRD totalIDA blendIDA onlyIDA totalIndiaIndonesiaIran, Islamic Rep.IraqIrelandIsraelItalyJamaicaJapanJordanKazakhstanKenyaKiribatiKorea, Rep.KuwaitKyrgyz RepublicLao PDRLate-demographic dividendLatin America & Caribbean Latin America & Caribbean (excluding high income)Latin America & the Caribbean (IDA & IBRD countries)LatviaLeast developed countries: UN classificationLebanonLesothoLiberiaLibyaLithuaniaLow & middle incomeLow incomeLower middle incomeLuxembourgMacao SAR, ChinaMacedonia, FYRMadagascarMalawiMalaysiaMaldivesMaliMaltaMauritaniaMauritiusMexicoMiddle East & North AfricaMiddle East & North Africa (excluding high income)Middle East & North Africa (IDA & IBRD countries)Middle incomeMoldovaMongoliaMoroccoMozambiqueMyanmarNamibiaNepalNetherlandsNew CaledoniaNew ZealandNicaraguaNigerNigeriaNorth AmericaNorwayOECD membersOmanOther small statesPacific island small statesPakistanPalauPanamaPapua New GuineaParaguayPeruPhilippinesPolandPortugalPost-demographic dividendPre-demographic dividendQatarRomaniaRussian FederationRwandaSamoaSao Tome and PrincipeSaudi ArabiaSenegalSerbiaSeychellesSierra LeoneSingaporeSlovak RepublicSloveniaSmall statesSolomon IslandsSomaliaSouth AfricaSouth AsiaSouth Asia (IDA & IBRD)SpainSri LankaSt. Kitts and NevisSt. LuciaSt. Vincent and the GrenadinesSub-Saharan Africa Sub-Saharan Africa (excluding high income)Sub-Saharan Africa (IDA & IBRD countries)SudanSurinameSwazilandSwedenSwitzerlandSyrian Arab RepublicTajikistanTanzaniaThailandTimor-LesteTogoTongaTrinidad and TobagoTunisiaTurkeyTurkmenistanTurks and Caicos IslandsTuvaluUgandaUkraineUnited Arab EmiratesUnited KingdomUnited StatesUpper middle incomeUruguayVanuatuVenezuela, RBVietnamVirgin Islands (U.S.)WorldYemen, Rep.ZambiaZimbabwe Linea del tempo:
Questa scala temporale mostra un grafico dal 1967 anno al 2015 anno. Middle East & North Africa (IDA & IBRD countries). I dati fino ad 1966 anno non disponibili. Il numero di osservazioni attuali secondo i date: 28.
La fonte (nome):
Indicatori dello sviluppo mondiale
La fonte (organizzazione):
World Bank staff estimates from the Comtrade database maintained by the United Nations Statistics Division.
Categorie:
Energy & Mining, Private Sector, Trade
sono stati aggiornati
23 apr 2017 anni
Indicatori delle variazioni dei valori per anni
Minima:
1.489
1 gen 1976 anni
Massimo:
4.607
1 gen 2009 anni
Alla data di osservazione
Valore
Variazione assoluta
La variazione rispetto al valore precedente
1 gen 1967 anni
2.027
+2.027
0.0%
1 gen 1968 anni
2.153
+0.126
6.19%
1 gen 1969 anni
2.241
+0.088
4.11%
1 gen 1970 anni
2.277
+0.036
1.59%
1 gen 1971 anni
2.447
+0.17
7.46%
1 gen 1972 anni
2.431
-0.016
-0.65%
1 gen 1973 anni
2.111
-0.32
-13.17%
1 gen 1974 anni
1.948
-0.162
-7.69%
1 gen 1975 anni
1.905
-0.044
-2.23%
1 gen 1976 anni
1.489
-0.416
-21.82%
1 gen 1977 anni
1.544
+0.055
3.66%
1 gen 1978 anni
2.258
+0.714
46.25%
1 gen 1998 anni
2.444
+0.186
8.24%
1 gen 1999 anni
2.184
-0.26
-10.63%
1 gen 2000 anni
2.091
-0.093
-4.25%
1 gen 2001 anni
1.816
-0.276
-13.18%
1 gen 2002 anni
1.82
+0.004
0.21%
1 gen 2003 anni
1.925
+0.105
5.77%
1 gen 2004 anni
2.125
+0.2
10.41%
1 gen 2005 anni
2.374
+0.249
11.72%
1 gen 2006 anni
2.426
+0.052
2.18%
1 gen 2007 anni
2.213
-0.213
-8.76%
1 gen 2008 anni
2.843
+0.63
28.48%
1 gen 2009 anni
4.607
+1.764
62.02%
1 gen 2010 anni
2.645
-1.962
-42.59%
1 gen 2011 anni
2.52
-0.125
-4.73%
1 gen 2012 anni
3.064
+0.544
21.6%
1 gen 2015 anni
3.034
-0.03
-0.98%
Classificazione dei paesi secondo i statistiche attuali per anni


Commenti: