29
/it/
it
AIzaSyAYiBZKx7MnpbEhh9jyipgxe19OcubqV5w
April 1, 2024
210815
Nicaragua
NIC
true
2
1
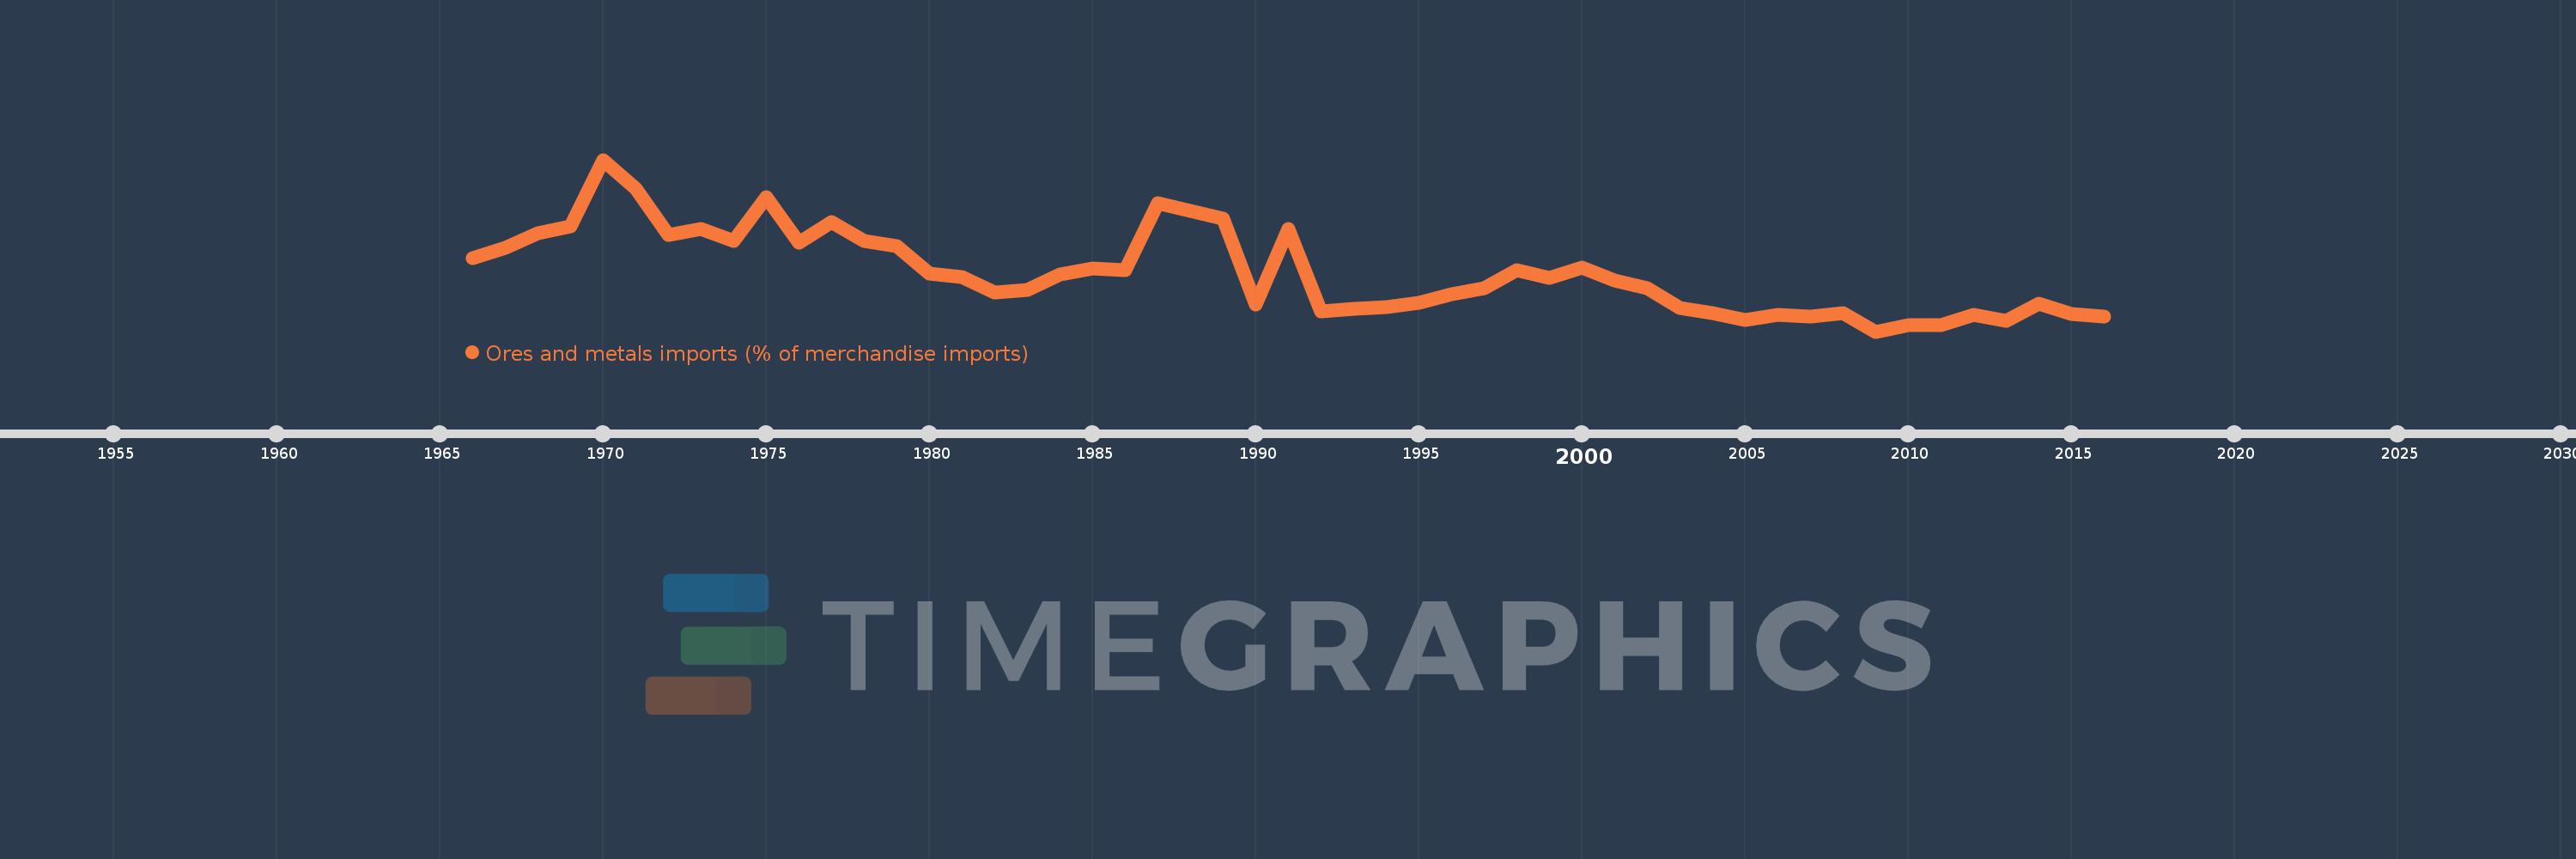
Ores and metals imports (% of merchandise imports)
2016,2015,2014,2013,2012,2011,2010,2009,2008,2007,2006,2005,2004,2003,2002,2001,2000,1999,1998,1997,1996,1995,1994,1993,1992,1991,1990,1989,1987,1986,1985,1984,1983,1982,1981,1980,1979,1978,1977,1976,1975,1974,1973,1972,1971,1970,1969,1968,1967,1966
Queste statistiche in altri paesi:
AfghanistanAlbaniaAlgeriaAndorraAngolaAntigua and BarbudaArab WorldArgentinaArmeniaArubaAustraliaAustriaAzerbaijanBahamas, TheBahrainBangladeshBarbadosBelarusBelgiumBelizeBeninBermudaBhutanBoliviaBosnia and HerzegovinaBotswanaBrazilBrunei DarussalamBulgariaBurkina FasoBurundiCabo VerdeCambodiaCameroonCanadaCaribbean small statesCayman IslandsCentral African RepublicCentral Europe and the BalticsChadChileChinaColombiaComorosCongo, Dem. Rep.Congo, Rep.Costa RicaCote d'IvoireCroatiaCubaCyprusCzech RepublicDenmarkDjiboutiDominicaDominican RepublicEarly-demographic dividendEast Asia & PacificEast Asia & Pacific (excluding high income)East Asia & Pacific (IDA & IBRD countries)EcuadorEgypt, Arab Rep.El SalvadorEquatorial GuineaEritreaEstoniaEthiopiaEuro areaEurope & Central AsiaEurope & Central Asia (excluding high income)Europe & Central Asia (IDA & IBRD countries)European UnionFaroe IslandsFijiFinlandFragile and conflict affected situationsFranceFrench PolynesiaGabonGambia, TheGeorgiaGermanyGhanaGreeceGreenlandGrenadaGuatemalaGuineaGuinea-BissauGuyanaHaitiHeavily indebted poor countries (HIPC)High incomeHondurasHong Kong SAR, ChinaHungaryIBRD onlyIcelandIDA & IBRD totalIDA blendIDA onlyIDA totalIndiaIndonesiaIran, Islamic Rep.IraqIrelandIsraelItalyJamaicaJapanJordanKazakhstanKenyaKiribatiKorea, Rep.KuwaitKyrgyz RepublicLao PDRLate-demographic dividendLatin America & Caribbean Latin America & Caribbean (excluding high income)Latin America & the Caribbean (IDA & IBRD countries)LatviaLeast developed countries: UN classificationLebanonLesothoLiberiaLibyaLithuaniaLow & middle incomeLow incomeLower middle incomeLuxembourgMacao SAR, ChinaMacedonia, FYRMadagascarMalawiMalaysiaMaldivesMaliMaltaMauritaniaMauritiusMexicoMiddle East & North AfricaMiddle East & North Africa (excluding high income)Middle East & North Africa (IDA & IBRD countries)Middle incomeMoldovaMongoliaMoroccoMozambiqueMyanmarNamibiaNepalNetherlandsNew CaledoniaNew ZealandNicaraguaNigerNigeriaNorth AmericaNorwayOECD membersOmanOther small statesPacific island small statesPakistanPalauPanamaPapua New GuineaParaguayPeruPhilippinesPolandPortugalPost-demographic dividendPre-demographic dividendQatarRomaniaRussian FederationRwandaSamoaSao Tome and PrincipeSaudi ArabiaSenegalSerbiaSeychellesSierra LeoneSingaporeSlovak RepublicSloveniaSmall statesSolomon IslandsSomaliaSouth AfricaSouth AsiaSouth Asia (IDA & IBRD)SpainSri LankaSt. Kitts and NevisSt. LuciaSt. Vincent and the GrenadinesSub-Saharan Africa Sub-Saharan Africa (excluding high income)Sub-Saharan Africa (IDA & IBRD countries)SudanSurinameSwazilandSwedenSwitzerlandSyrian Arab RepublicTajikistanTanzaniaThailandTimor-LesteTogoTongaTrinidad and TobagoTunisiaTurkeyTurkmenistanTurks and Caicos IslandsTuvaluUgandaUkraineUnited Arab EmiratesUnited KingdomUnited StatesUpper middle incomeUruguayVanuatuVenezuela, RBVietnamVirgin Islands (U.S.)WorldYemen, Rep.ZambiaZimbabwe Linea del tempo:
Questa scala temporale mostra un grafico dal 1966 anno al 2016 anno. Nicaragua. I dati fino ad 1965 anno non disponibili. Il numero di osservazioni attuali secondo i date: 50.
La fonte (nome):
Indicatori dello sviluppo mondiale
La fonte (organizzazione):
World Bank staff estimates from the Comtrade database maintained by the United Nations Statistics Division.
Categorie:
Energy & Mining, Private Sector, Trade
sono stati aggiornati
23 apr 2017 anni
Indicatori delle variazioni dei valori per anni
Minima:
0.271
1 gen 2009 anni
Massimo:
1.925
1 gen 1970 anni
Alla data di osservazione
Valore
Variazione assoluta
La variazione rispetto al valore precedente
1 gen 1966 anni
0.982
+0.982
0.0%
1 gen 1967 anni
1.074
+0.092
9.36%
1 gen 1968 anni
1.215
+0.142
13.19%
1 gen 1969 anni
1.281
+0.066
5.43%
1 gen 1970 anni
1.925
+0.643
50.2%
1 gen 1971 anni
1.646
-0.279
-14.49%
1 gen 1972 anni
1.203
-0.443
-26.89%
1 gen 1973 anni
1.256
+0.053
4.37%
1 gen 1974 anni
1.146
-0.11
-8.74%
1 gen 1975 anni
1.566
+0.42
36.67%
1 gen 1976 anni
1.13
-0.436
-27.85%
1 gen 1977 anni
1.328
+0.199
17.58%
1 gen 1978 anni
1.141
-0.188
-14.14%
1 gen 1979 anni
1.097
-0.044
-3.87%
1 gen 1980 anni
0.831
-0.265
-24.19%
1 gen 1981 anni
0.793
-0.038
-4.56%
1 gen 1982 anni
0.65
-0.143
-18.04%
1 gen 1983 anni
0.676
+0.025
3.91%
1 gen 1984 anni
0.823
+0.147
21.79%
1 gen 1985 anni
0.882
+0.059
7.19%
1 gen 1986 anni
0.862
-0.02
-2.26%
1 gen 1987 anni
1.508
+0.645
74.86%
1 gen 1989 anni
1.355
-0.152
-10.1%
1 gen 1990 anni
0.531
-0.825
-60.84%
1 gen 1991 anni
1.256
+0.725
136.61%
1 gen 1992 anni
0.464
-0.792
-63.07%
1 gen 1993 anni
0.488
+0.024
5.22%
1 gen 1994 anni
0.507
+0.019
3.83%
1 gen 1995 anni
0.546
+0.039
7.71%
1 gen 1996 anni
0.632
+0.087
15.86%
1 gen 1997 anni
0.692
+0.059
9.39%
1 gen 1998 anni
0.859
+0.167
24.12%
1 gen 1999 anni
0.788
-0.071
-8.24%
1 gen 2000 anni
0.886
+0.098
12.44%
1 gen 2001 anni
0.764
-0.122
-13.79%
1 gen 2002 anni
0.685
-0.079
-10.33%
1 gen 2003 anni
0.498
-0.187
-27.26%
1 gen 2004 anni
0.449
-0.049
-9.84%
1 gen 2005 anni
0.379
-0.07
-15.64%
1 gen 2006 anni
0.43
+0.051
13.44%
1 gen 2007 anni
0.412
-0.017
-4.04%
1 gen 2008 anni
0.448
+0.035
8.54%
1 gen 2009 anni
0.271
-0.176
-39.36%
1 gen 2010 anni
0.329
+0.058
21.41%
1 gen 2011 anni
0.336
+0.006
1.92%
1 gen 2012 anni
0.435
+0.099
29.47%
1 gen 2013 anni
0.374
-0.061
-14.06%
1 gen 2014 anni
0.538
+0.164
44.02%
1 gen 2015 anni
0.437
-0.101
-18.84%
1 gen 2016 anni
0.415
-0.022
-5.0%
Classificazione dei paesi secondo i statistiche attuali per anni


Commenti: