29
/it/
it
AIzaSyAYiBZKx7MnpbEhh9jyipgxe19OcubqV5w
April 1, 2024
37661
IDA & IBRD total
IBT
false
2
1
Ores and metals imports (% of merchandise imports)
2016,2015,2014,2013,2012,2011,2010,2009,2008,2007,2006,2005,2004,2003,2002,2001,2000,1999,1998,1997,1996,1995,1994,1993,1992,1991,1990,1989,1988,1987,1986,1985
Queste statistiche in altri paesi:
AfghanistanAlbaniaAlgeriaAndorraAngolaAntigua and BarbudaArab WorldArgentinaArmeniaArubaAustraliaAustriaAzerbaijanBahamas, TheBahrainBangladeshBarbadosBelarusBelgiumBelizeBeninBermudaBhutanBoliviaBosnia and HerzegovinaBotswanaBrazilBrunei DarussalamBulgariaBurkina FasoBurundiCabo VerdeCambodiaCameroonCanadaCaribbean small statesCayman IslandsCentral African RepublicCentral Europe and the BalticsChadChileChinaColombiaComorosCongo, Dem. Rep.Congo, Rep.Costa RicaCote d'IvoireCroatiaCubaCyprusCzech RepublicDenmarkDjiboutiDominicaDominican RepublicEarly-demographic dividendEast Asia & PacificEast Asia & Pacific (excluding high income)East Asia & Pacific (IDA & IBRD countries)EcuadorEgypt, Arab Rep.El SalvadorEquatorial GuineaEritreaEstoniaEthiopiaEuro areaEurope & Central AsiaEurope & Central Asia (excluding high income)Europe & Central Asia (IDA & IBRD countries)European UnionFaroe IslandsFijiFinlandFragile and conflict affected situationsFranceFrench PolynesiaGabonGambia, TheGeorgiaGermanyGhanaGreeceGreenlandGrenadaGuatemalaGuineaGuinea-BissauGuyanaHaitiHeavily indebted poor countries (HIPC)High incomeHondurasHong Kong SAR, ChinaHungaryIBRD onlyIcelandIDA & IBRD totalIDA blendIDA onlyIDA totalIndiaIndonesiaIran, Islamic Rep.IraqIrelandIsraelItalyJamaicaJapanJordanKazakhstanKenyaKiribatiKorea, Rep.KuwaitKyrgyz RepublicLao PDRLate-demographic dividendLatin America & Caribbean Latin America & Caribbean (excluding high income)Latin America & the Caribbean (IDA & IBRD countries)LatviaLeast developed countries: UN classificationLebanonLesothoLiberiaLibyaLithuaniaLow & middle incomeLow incomeLower middle incomeLuxembourgMacao SAR, ChinaMacedonia, FYRMadagascarMalawiMalaysiaMaldivesMaliMaltaMauritaniaMauritiusMexicoMiddle East & North AfricaMiddle East & North Africa (excluding high income)Middle East & North Africa (IDA & IBRD countries)Middle incomeMoldovaMongoliaMoroccoMozambiqueMyanmarNamibiaNepalNetherlandsNew CaledoniaNew ZealandNicaraguaNigerNigeriaNorth AmericaNorwayOECD membersOmanOther small statesPacific island small statesPakistanPalauPanamaPapua New GuineaParaguayPeruPhilippinesPolandPortugalPost-demographic dividendPre-demographic dividendQatarRomaniaRussian FederationRwandaSamoaSao Tome and PrincipeSaudi ArabiaSenegalSerbiaSeychellesSierra LeoneSingaporeSlovak RepublicSloveniaSmall statesSolomon IslandsSomaliaSouth AfricaSouth AsiaSouth Asia (IDA & IBRD)SpainSri LankaSt. Kitts and NevisSt. LuciaSt. Vincent and the GrenadinesSub-Saharan Africa Sub-Saharan Africa (excluding high income)Sub-Saharan Africa (IDA & IBRD countries)SudanSurinameSwazilandSwedenSwitzerlandSyrian Arab RepublicTajikistanTanzaniaThailandTimor-LesteTogoTongaTrinidad and TobagoTunisiaTurkeyTurkmenistanTurks and Caicos IslandsTuvaluUgandaUkraineUnited Arab EmiratesUnited KingdomUnited StatesUpper middle incomeUruguayVanuatuVenezuela, RBVietnamVirgin Islands (U.S.)WorldYemen, Rep.ZambiaZimbabwe Linea del tempo:
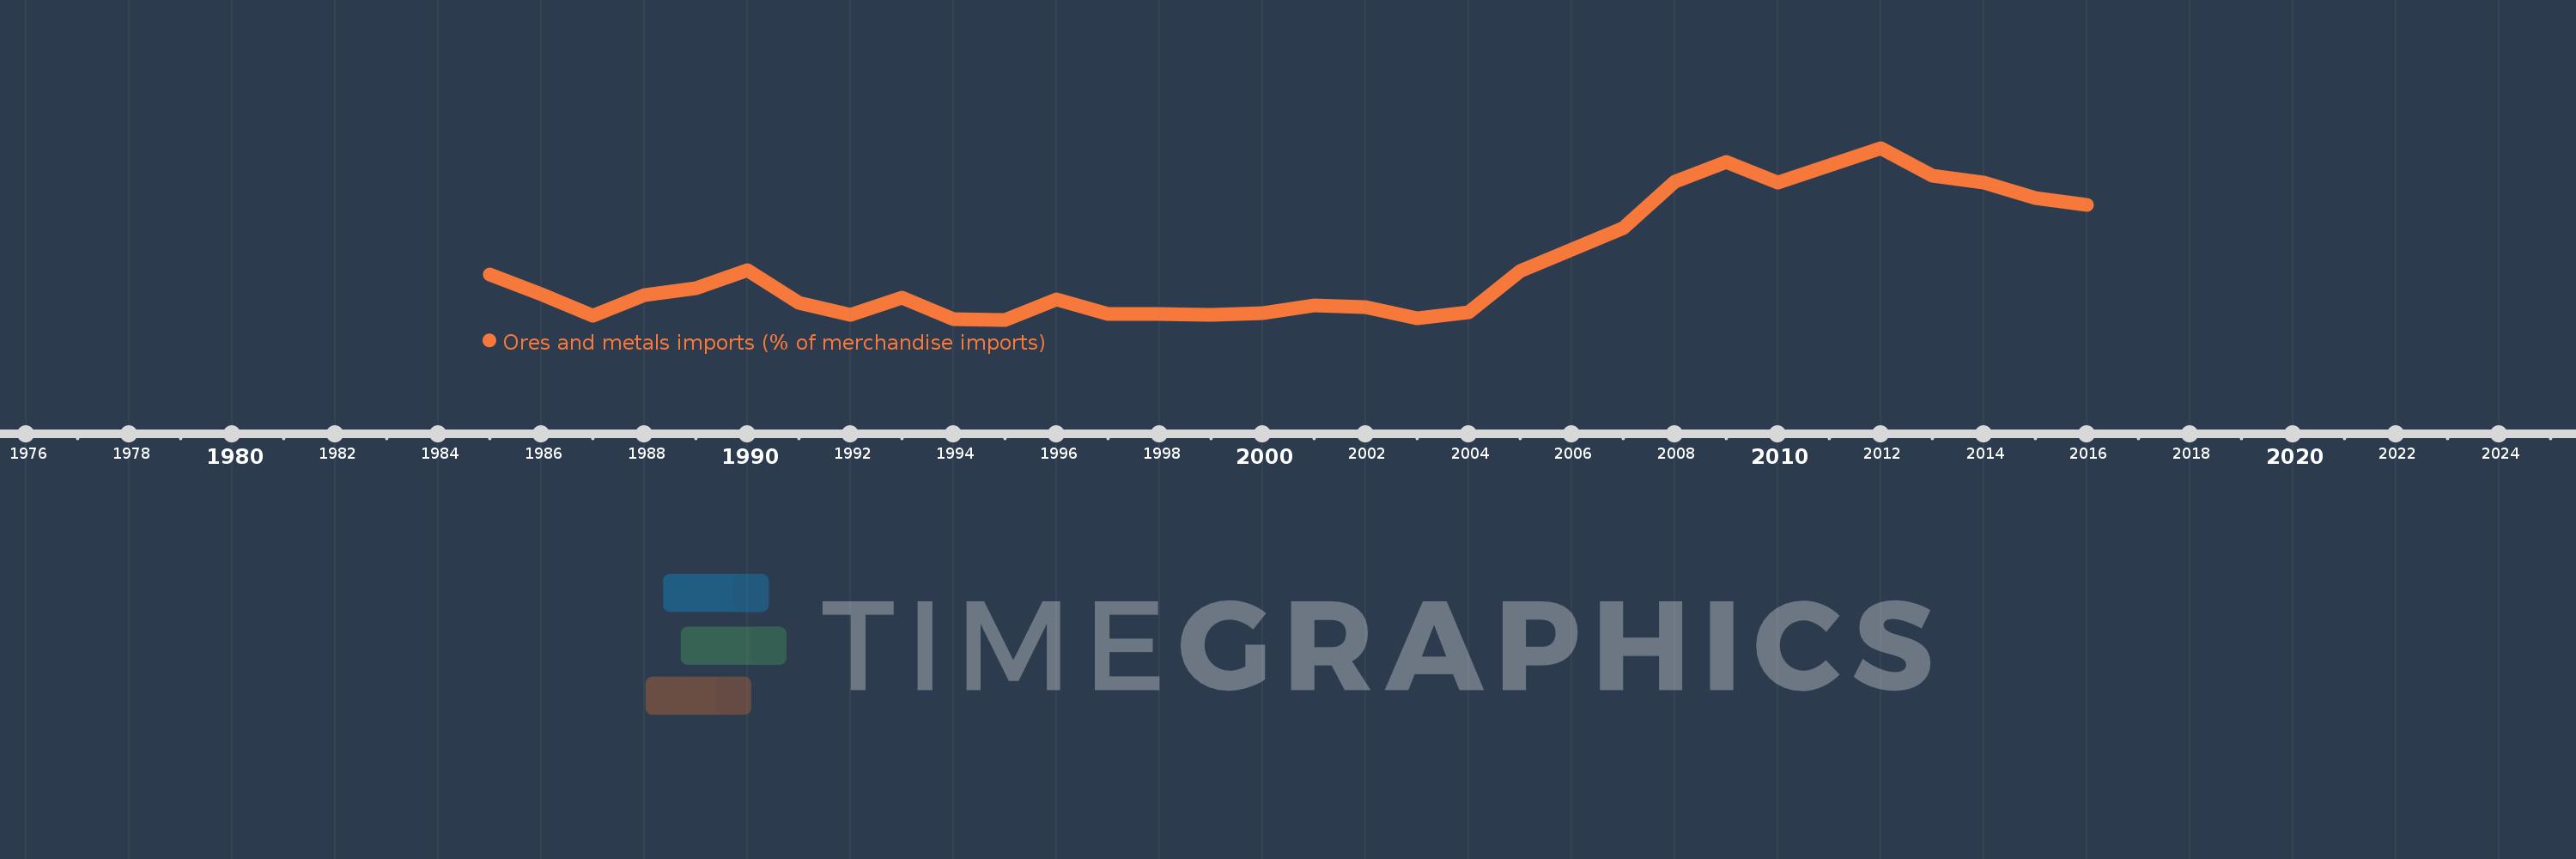
Questa scala temporale mostra un grafico dal 1985 anno al 2016 anno. IDA & IBRD total. I dati fino ad 1984 anno non disponibili. Il numero di osservazioni attuali secondo i date: 32.
La fonte (nome):
Indicatori dello sviluppo mondiale
La fonte (organizzazione):
World Bank staff estimates from the Comtrade database maintained by the United Nations Statistics Division.
Categorie:
Energy & Mining, Private Sector, Trade
sono stati aggiornati
23 apr 2017 anni
Indicatori delle variazioni dei valori per anni
Minima:
3.375
1 gen 1995 anni
Massimo:
6.884
1 gen 2012 anni
Alla data di osservazione
Valore
Variazione assoluta
La variazione rispetto al valore precedente
1 gen 1985 anni
4.299
+4.299
0.0%
1 gen 1986 anni
3.893
-0.406
-9.44%
1 gen 1987 anni
3.454
-0.439
-11.29%
1 gen 1988 anni
3.874
+0.42
12.15%
1 gen 1989 anni
4.014
+0.141
3.63%
1 gen 1990 anni
4.394
+0.379
9.45%
1 gen 1991 anni
3.712
-0.682
-15.52%
1 gen 1992 anni
3.483
-0.228
-6.16%
1 gen 1993 anni
3.834
+0.351
10.08%
1 gen 1994 anni
3.379
-0.456
-11.89%
1 gen 1995 anni
3.375
-0.004
-0.11%
1 gen 1996 anni
3.793
+0.418
12.39%
1 gen 1997 anni
3.501
-0.292
-7.7%
1 gen 1998 anni
3.499
-0.002
-0.06%
1 gen 1999 anni
3.475
-0.024
-0.69%
1 gen 2000 anni
3.504
+0.029
0.84%
1 gen 2001 anni
3.66
+0.156
4.46%
1 gen 2002 anni
3.636
-0.024
-0.66%
1 gen 2003 anni
3.403
-0.232
-6.39%
1 gen 2004 anni
3.536
+0.133
3.9%
1 gen 2005 anni
4.372
+0.836
23.63%
1 gen 2006 anni
4.811
+0.439
10.05%
1 gen 2007 anni
5.253
+0.442
9.19%
1 gen 2008 anni
6.195
+0.942
17.94%
1 gen 2009 anni
6.594
+0.399
6.43%
1 gen 2010 anni
6.171
-0.423
-6.42%
1 gen 2011 anni
6.535
+0.364
5.9%
1 gen 2012 anni
6.884
+0.35
5.35%
1 gen 2013 anni
6.317
-0.567
-8.24%
1 gen 2014 anni
6.182
-0.135
-2.14%
1 gen 2015 anni
5.854
-0.328
-5.31%
1 gen 2016 anni
5.714
-0.139
-2.38%
Classificazione dei paesi secondo i statistiche attuali per anni


Commenti: