29
/it/
it
AIzaSyAYiBZKx7MnpbEhh9jyipgxe19OcubqV5w
April 1, 2024
150829
Honduras
HND
true
2
1
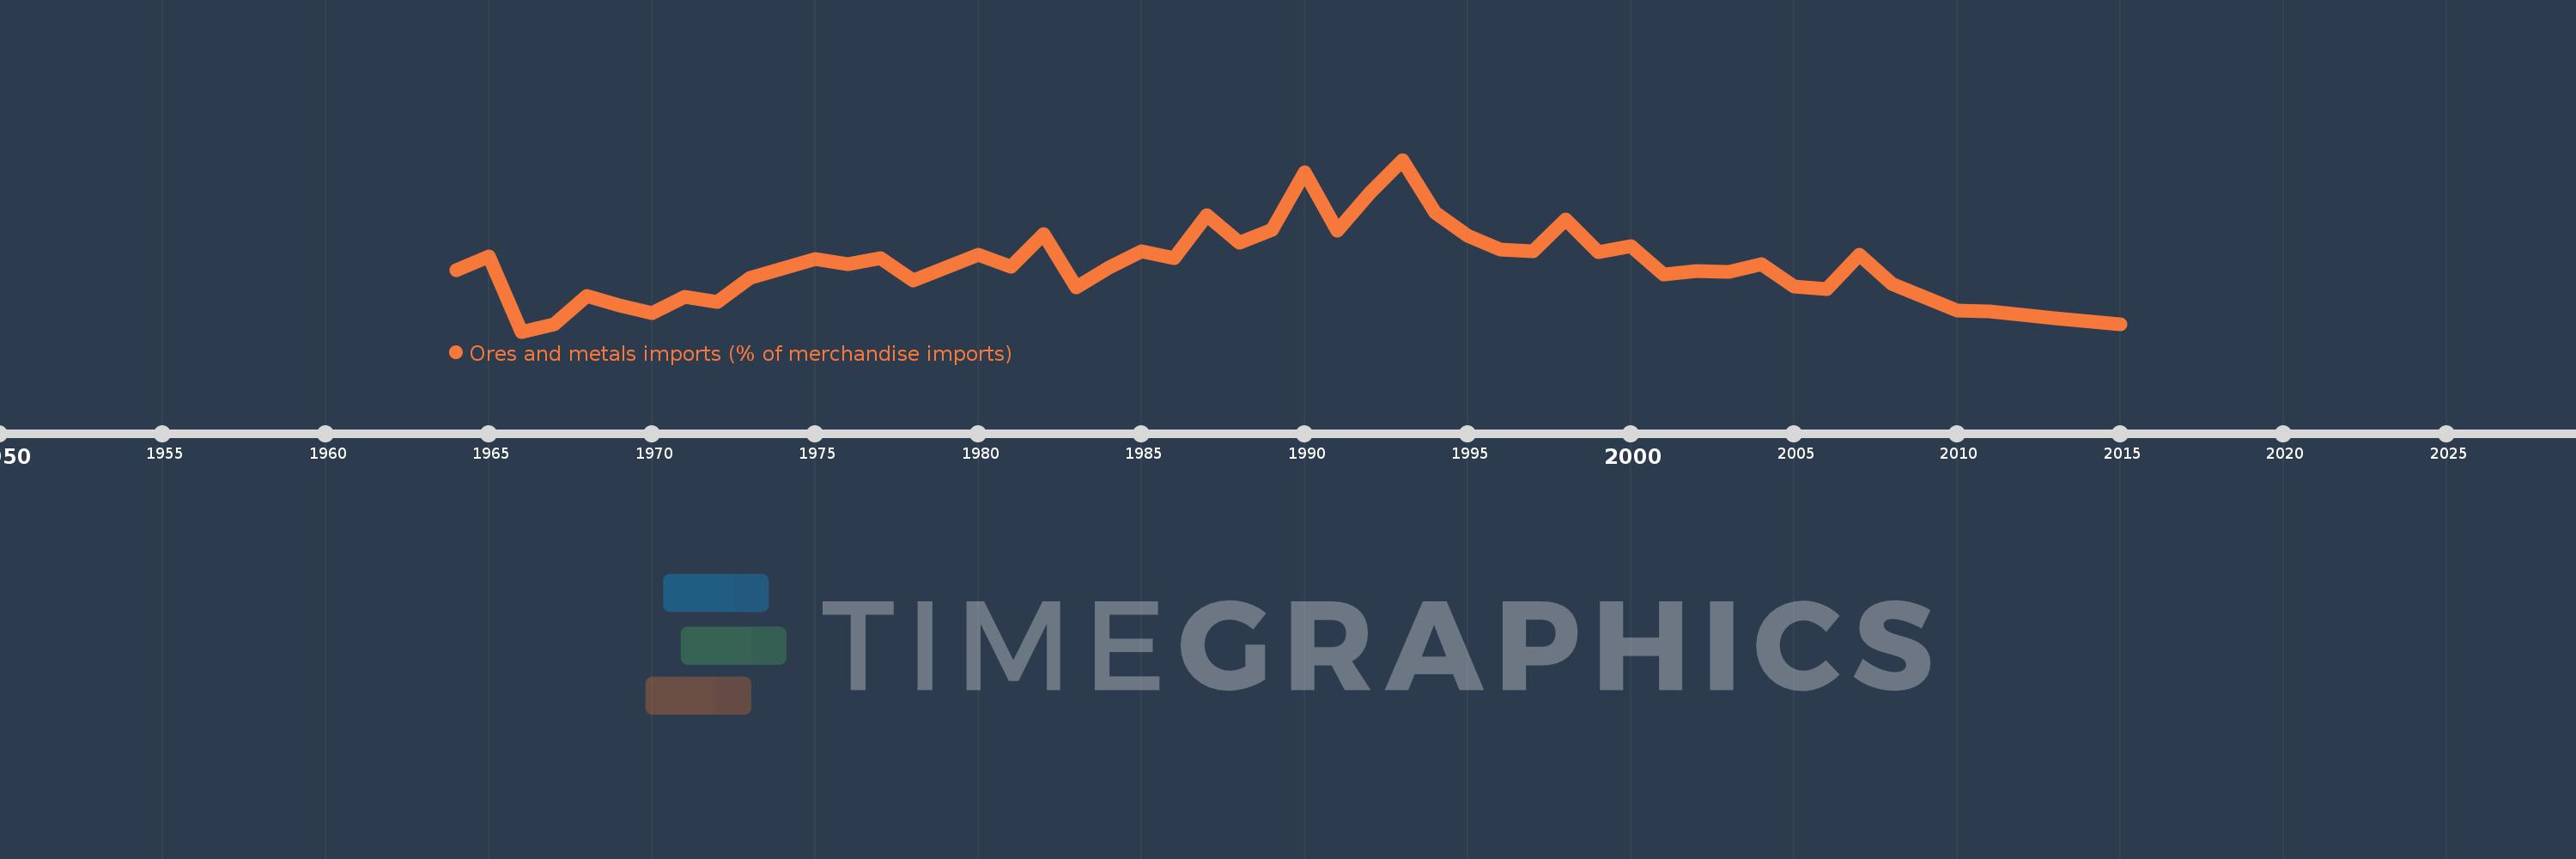
Ores and metals imports (% of merchandise imports)
2015,2013,2012,2011,2010,2008,2007,2006,2005,2004,2003,2002,2001,2000,1999,1998,1997,1996,1995,1994,1993,1992,1991,1990,1989,1988,1987,1986,1985,1984,1983,1982,1981,1980,1979,1978,1977,1976,1975,1974,1973,1972,1971,1970,1969,1968,1967,1966,1965,1964
Queste statistiche in altri paesi:
AfghanistanAlbaniaAlgeriaAndorraAngolaAntigua and BarbudaArab WorldArgentinaArmeniaArubaAustraliaAustriaAzerbaijanBahamas, TheBahrainBangladeshBarbadosBelarusBelgiumBelizeBeninBermudaBhutanBoliviaBosnia and HerzegovinaBotswanaBrazilBrunei DarussalamBulgariaBurkina FasoBurundiCabo VerdeCambodiaCameroonCanadaCaribbean small statesCayman IslandsCentral African RepublicCentral Europe and the BalticsChadChileChinaColombiaComorosCongo, Dem. Rep.Congo, Rep.Costa RicaCote d'IvoireCroatiaCubaCyprusCzech RepublicDenmarkDjiboutiDominicaDominican RepublicEarly-demographic dividendEast Asia & PacificEast Asia & Pacific (excluding high income)East Asia & Pacific (IDA & IBRD countries)EcuadorEgypt, Arab Rep.El SalvadorEquatorial GuineaEritreaEstoniaEthiopiaEuro areaEurope & Central AsiaEurope & Central Asia (excluding high income)Europe & Central Asia (IDA & IBRD countries)European UnionFaroe IslandsFijiFinlandFragile and conflict affected situationsFranceFrench PolynesiaGabonGambia, TheGeorgiaGermanyGhanaGreeceGreenlandGrenadaGuatemalaGuineaGuinea-BissauGuyanaHaitiHeavily indebted poor countries (HIPC)High incomeHondurasHong Kong SAR, ChinaHungaryIBRD onlyIcelandIDA & IBRD totalIDA blendIDA onlyIDA totalIndiaIndonesiaIran, Islamic Rep.IraqIrelandIsraelItalyJamaicaJapanJordanKazakhstanKenyaKiribatiKorea, Rep.KuwaitKyrgyz RepublicLao PDRLate-demographic dividendLatin America & Caribbean Latin America & Caribbean (excluding high income)Latin America & the Caribbean (IDA & IBRD countries)LatviaLeast developed countries: UN classificationLebanonLesothoLiberiaLibyaLithuaniaLow & middle incomeLow incomeLower middle incomeLuxembourgMacao SAR, ChinaMacedonia, FYRMadagascarMalawiMalaysiaMaldivesMaliMaltaMauritaniaMauritiusMexicoMiddle East & North AfricaMiddle East & North Africa (excluding high income)Middle East & North Africa (IDA & IBRD countries)Middle incomeMoldovaMongoliaMoroccoMozambiqueMyanmarNamibiaNepalNetherlandsNew CaledoniaNew ZealandNicaraguaNigerNigeriaNorth AmericaNorwayOECD membersOmanOther small statesPacific island small statesPakistanPalauPanamaPapua New GuineaParaguayPeruPhilippinesPolandPortugalPost-demographic dividendPre-demographic dividendQatarRomaniaRussian FederationRwandaSamoaSao Tome and PrincipeSaudi ArabiaSenegalSerbiaSeychellesSierra LeoneSingaporeSlovak RepublicSloveniaSmall statesSolomon IslandsSomaliaSouth AfricaSouth AsiaSouth Asia (IDA & IBRD)SpainSri LankaSt. Kitts and NevisSt. LuciaSt. Vincent and the GrenadinesSub-Saharan Africa Sub-Saharan Africa (excluding high income)Sub-Saharan Africa (IDA & IBRD countries)SudanSurinameSwazilandSwedenSwitzerlandSyrian Arab RepublicTajikistanTanzaniaThailandTimor-LesteTogoTongaTrinidad and TobagoTunisiaTurkeyTurkmenistanTurks and Caicos IslandsTuvaluUgandaUkraineUnited Arab EmiratesUnited KingdomUnited StatesUpper middle incomeUruguayVanuatuVenezuela, RBVietnamVirgin Islands (U.S.)WorldYemen, Rep.ZambiaZimbabwe Linea del tempo:
Questa scala temporale mostra un grafico dal 1964 anno al 2015 anno. Honduras. I dati fino ad 1963 anno non disponibili. Il numero di osservazioni attuali secondo i date: 50.
La fonte (nome):
Indicatori dello sviluppo mondiale
La fonte (organizzazione):
World Bank staff estimates from the Comtrade database maintained by the United Nations Statistics Division.
Categorie:
Energy & Mining, Private Sector, Trade
sono stati aggiornati
23 apr 2017 anni
Indicatori delle variazioni dei valori per anni
Minima:
0.549
1 gen 1966 anni
Massimo:
1.93
1 gen 1993 anni
Alla data di osservazione
Valore
Variazione assoluta
La variazione rispetto al valore precedente
1 gen 1964 anni
1.045
+1.045
0.0%
1 gen 1965 anni
1.154
+0.109
10.43%
1 gen 1966 anni
0.549
-0.605
-52.43%
1 gen 1967 anni
0.607
+0.058
10.59%
1 gen 1968 anni
0.836
+0.229
37.74%
1 gen 1969 anni
0.758
-0.078
-9.37%
1 gen 1970 anni
0.698
-0.06
-7.94%
1 gen 1971 anni
0.831
+0.133
19.11%
1 gen 1972 anni
0.789
-0.042
-5.11%
1 gen 1973 anni
0.979
+0.19
24.05%
1 gen 1974 anni
1.057
+0.078
7.98%
1 gen 1975 anni
1.13
+0.073
6.95%
1 gen 1976 anni
1.091
-0.039
-3.43%
1 gen 1977 anni
1.137
+0.045
4.16%
1 gen 1978 anni
0.961
-0.175
-15.42%
1 gen 1979 anni
1.061
+0.099
10.32%
1 gen 1980 anni
1.167
+0.106
10.01%
1 gen 1981 anni
1.071
-0.096
-8.24%
1 gen 1982 anni
1.33
+0.259
24.19%
1 gen 1983 anni
0.905
-0.425
-31.96%
1 gen 1984 anni
1.061
+0.156
17.26%
1 gen 1985 anni
1.194
+0.133
12.5%
1 gen 1986 anni
1.14
-0.054
-4.52%
1 gen 1987 anni
1.486
+0.346
30.4%
1 gen 1988 anni
1.267
-0.219
-14.74%
1 gen 1989 anni
1.367
+0.1
7.87%
1 gen 1990 anni
1.828
+0.462
33.8%
1 gen 1991 anni
1.359
-0.47
-25.68%
1 gen 1992 anni
1.664
+0.305
22.43%
1 gen 1993 anni
1.93
+0.266
15.98%
1 gen 1994 anni
1.504
-0.426
-22.07%
1 gen 1995 anni
1.319
-0.185
-12.29%
1 gen 1996 anni
1.211
-0.108
-8.2%
1 gen 1997 anni
1.194
-0.017
-1.4%
1 gen 1998 anni
1.448
+0.254
21.31%
1 gen 1999 anni
1.191
-0.258
-17.8%
1 gen 2000 anni
1.237
+0.046
3.89%
1 gen 2001 anni
1.008
-0.229
-18.49%
1 gen 2002 anni
1.034
+0.026
2.6%
1 gen 2003 anni
1.03
-0.004
-0.39%
1 gen 2004 anni
1.088
+0.058
5.62%
1 gen 2005 anni
0.911
-0.177
-16.27%
1 gen 2006 anni
0.893
-0.019
-2.04%
1 gen 2007 anni
1.165
+0.272
30.48%
1 gen 2008 anni
0.93
-0.235
-20.17%
1 gen 2010 anni
0.715
-0.215
-23.16%
1 gen 2011 anni
0.709
-0.006
-0.82%
1 gen 2012 anni
0.685
-0.024
-3.35%
1 gen 2013 anni
0.657
-0.028
-4.07%
1 gen 2015 anni
0.607
-0.05
-7.68%
Classificazione dei paesi secondo i statistiche attuali per anni


Commenti: