29
/it/
it
AIzaSyAYiBZKx7MnpbEhh9jyipgxe19OcubqV5w
April 1, 2024
240811
Singapore
SGP
true
2
1
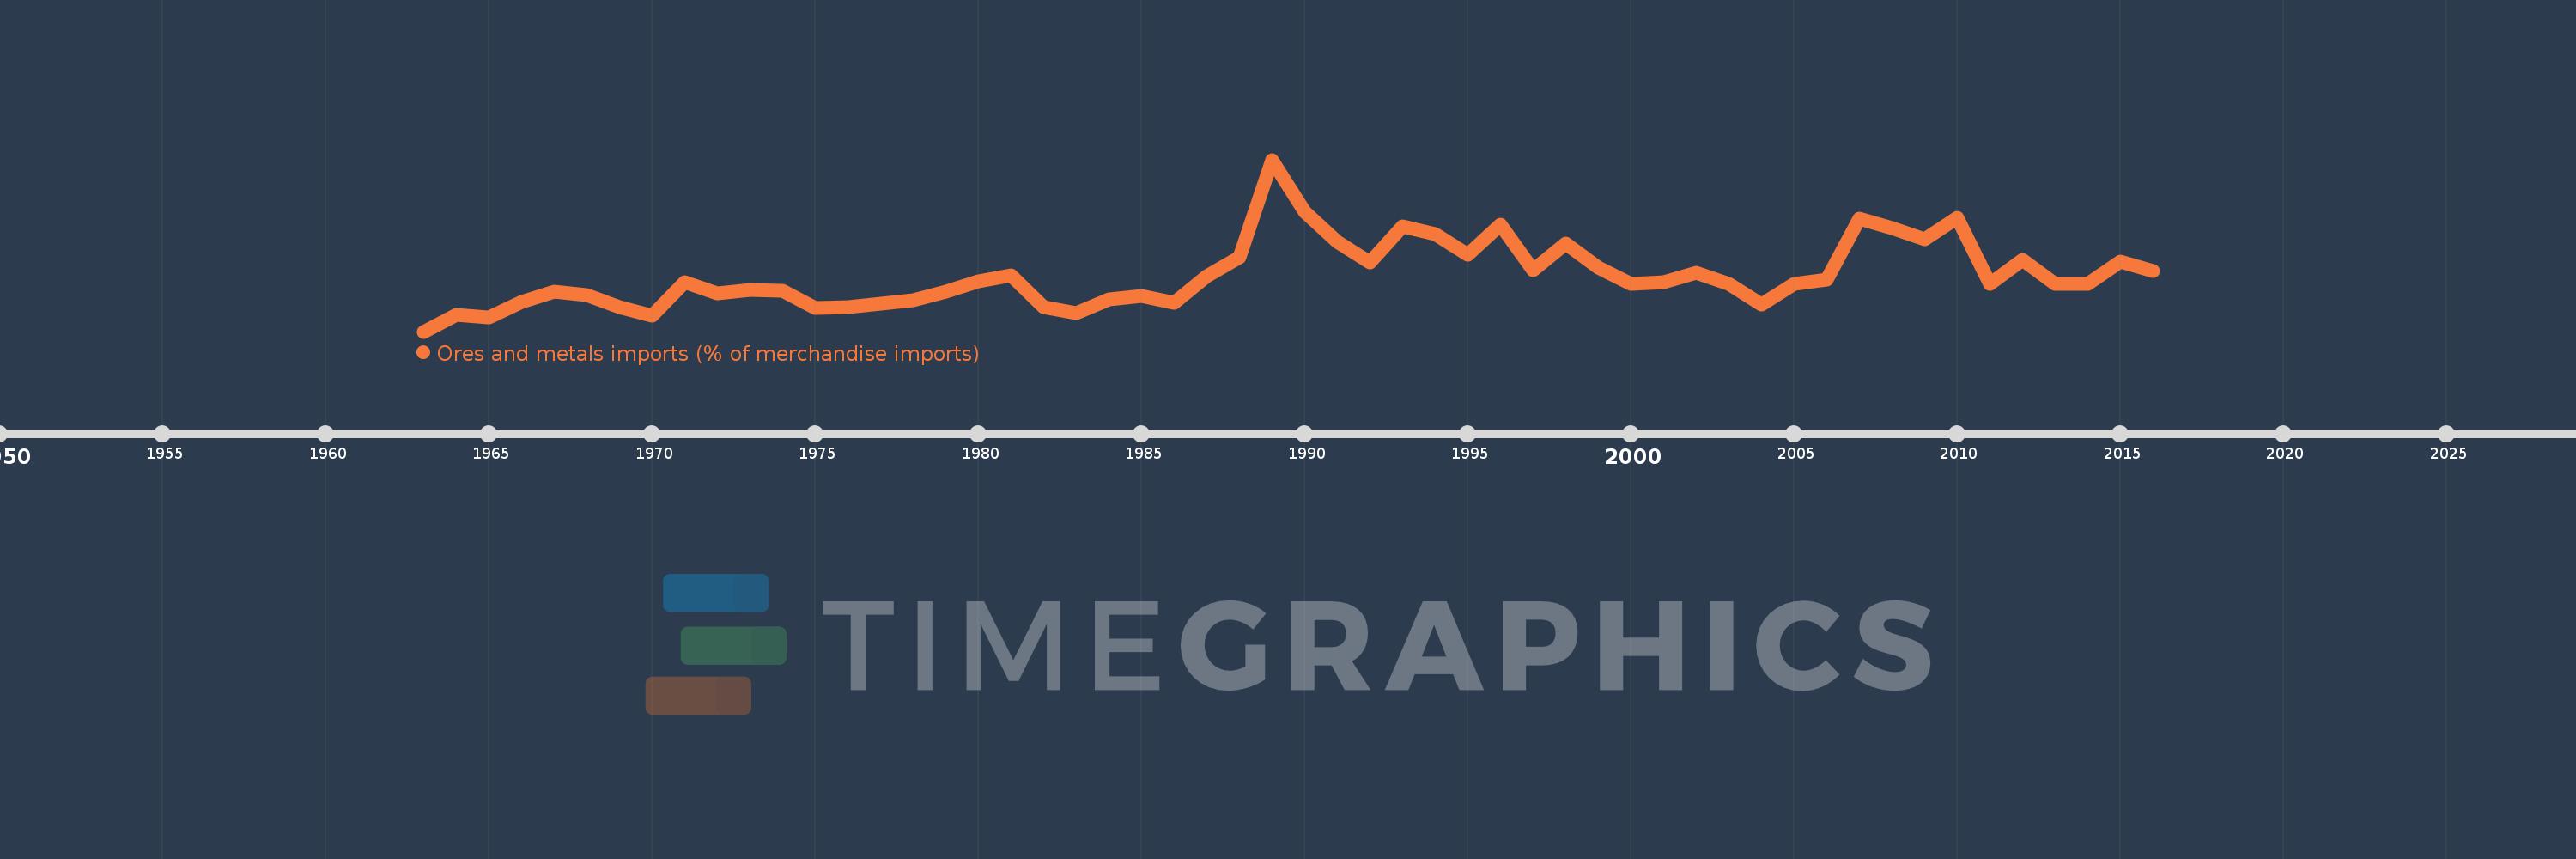
Ores and metals imports (% of merchandise imports)
2016,2015,2014,2013,2012,2011,2010,2009,2008,2007,2006,2005,2004,2003,2002,2001,2000,1999,1998,1997,1996,1995,1994,1993,1992,1991,1990,1989,1988,1987,1986,1985,1984,1983,1982,1981,1980,1979,1978,1977,1976,1975,1974,1973,1972,1971,1970,1969,1968,1967,1966,1965,1964,1963
Queste statistiche in altri paesi:
AfghanistanAlbaniaAlgeriaAndorraAngolaAntigua and BarbudaArab WorldArgentinaArmeniaArubaAustraliaAustriaAzerbaijanBahamas, TheBahrainBangladeshBarbadosBelarusBelgiumBelizeBeninBermudaBhutanBoliviaBosnia and HerzegovinaBotswanaBrazilBrunei DarussalamBulgariaBurkina FasoBurundiCabo VerdeCambodiaCameroonCanadaCaribbean small statesCayman IslandsCentral African RepublicCentral Europe and the BalticsChadChileChinaColombiaComorosCongo, Dem. Rep.Congo, Rep.Costa RicaCote d'IvoireCroatiaCubaCyprusCzech RepublicDenmarkDjiboutiDominicaDominican RepublicEarly-demographic dividendEast Asia & PacificEast Asia & Pacific (excluding high income)East Asia & Pacific (IDA & IBRD countries)EcuadorEgypt, Arab Rep.El SalvadorEquatorial GuineaEritreaEstoniaEthiopiaEuro areaEurope & Central AsiaEurope & Central Asia (excluding high income)Europe & Central Asia (IDA & IBRD countries)European UnionFaroe IslandsFijiFinlandFragile and conflict affected situationsFranceFrench PolynesiaGabonGambia, TheGeorgiaGermanyGhanaGreeceGreenlandGrenadaGuatemalaGuineaGuinea-BissauGuyanaHaitiHeavily indebted poor countries (HIPC)High incomeHondurasHong Kong SAR, ChinaHungaryIBRD onlyIcelandIDA & IBRD totalIDA blendIDA onlyIDA totalIndiaIndonesiaIran, Islamic Rep.IraqIrelandIsraelItalyJamaicaJapanJordanKazakhstanKenyaKiribatiKorea, Rep.KuwaitKyrgyz RepublicLao PDRLate-demographic dividendLatin America & Caribbean Latin America & Caribbean (excluding high income)Latin America & the Caribbean (IDA & IBRD countries)LatviaLeast developed countries: UN classificationLebanonLesothoLiberiaLibyaLithuaniaLow & middle incomeLow incomeLower middle incomeLuxembourgMacao SAR, ChinaMacedonia, FYRMadagascarMalawiMalaysiaMaldivesMaliMaltaMauritaniaMauritiusMexicoMiddle East & North AfricaMiddle East & North Africa (excluding high income)Middle East & North Africa (IDA & IBRD countries)Middle incomeMoldovaMongoliaMoroccoMozambiqueMyanmarNamibiaNepalNetherlandsNew CaledoniaNew ZealandNicaraguaNigerNigeriaNorth AmericaNorwayOECD membersOmanOther small statesPacific island small statesPakistanPalauPanamaPapua New GuineaParaguayPeruPhilippinesPolandPortugalPost-demographic dividendPre-demographic dividendQatarRomaniaRussian FederationRwandaSamoaSao Tome and PrincipeSaudi ArabiaSenegalSerbiaSeychellesSierra LeoneSingaporeSlovak RepublicSloveniaSmall statesSolomon IslandsSomaliaSouth AfricaSouth AsiaSouth Asia (IDA & IBRD)SpainSri LankaSt. Kitts and NevisSt. LuciaSt. Vincent and the GrenadinesSub-Saharan Africa Sub-Saharan Africa (excluding high income)Sub-Saharan Africa (IDA & IBRD countries)SudanSurinameSwazilandSwedenSwitzerlandSyrian Arab RepublicTajikistanTanzaniaThailandTimor-LesteTogoTongaTrinidad and TobagoTunisiaTurkeyTurkmenistanTurks and Caicos IslandsTuvaluUgandaUkraineUnited Arab EmiratesUnited KingdomUnited StatesUpper middle incomeUruguayVanuatuVenezuela, RBVietnamVirgin Islands (U.S.)WorldYemen, Rep.ZambiaZimbabwe Linea del tempo:
Questa scala temporale mostra un grafico dal 1963 anno al 2016 anno. Singapore. I dati fino ad 1962 anno non disponibili. Il numero di osservazioni attuali secondo i date: 54.
La fonte (nome):
Indicatori dello sviluppo mondiale
La fonte (organizzazione):
World Bank staff estimates from the Comtrade database maintained by the United Nations Statistics Division.
Categorie:
Energy & Mining, Private Sector, Trade
sono stati aggiornati
23 apr 2017 anni
Indicatori delle variazioni dei valori per anni
Minima:
0.997
1 gen 1963 anni
Massimo:
3.08
1 gen 1989 anni
Alla data di osservazione
Valore
Variazione assoluta
La variazione rispetto al valore precedente
1 gen 1963 anni
0.997
+0.997
0.0%
1 gen 1964 anni
1.201
+0.204
20.43%
1 gen 1965 anni
1.173
-0.028
-2.32%
1 gen 1966 anni
1.354
+0.181
15.42%
1 gen 1967 anni
1.478
+0.124
9.16%
1 gen 1968 anni
1.436
-0.042
-2.84%
1 gen 1969 anni
1.294
-0.142
-9.89%
1 gen 1970 anni
1.19
-0.104
-8.0%
1 gen 1971 anni
1.593
+0.403
33.83%
1 gen 1972 anni
1.463
-0.13
-8.15%
1 gen 1973 anni
1.503
+0.039
2.69%
1 gen 1974 anni
1.488
-0.015
-0.97%
1 gen 1975 anni
1.285
-0.203
-13.67%
1 gen 1976 anni
1.292
+0.008
0.59%
1 gen 1977 anni
1.337
+0.045
3.46%
1 gen 1978 anni
1.382
+0.045
3.36%
1 gen 1979 anni
1.481
+0.099
7.17%
1 gen 1980 anni
1.608
+0.127
8.6%
1 gen 1981 anni
1.678
+0.07
4.36%
1 gen 1982 anni
1.292
-0.386
-23.0%
1 gen 1983 anni
1.219
-0.073
-5.65%
1 gen 1984 anni
1.391
+0.172
14.08%
1 gen 1985 anni
1.433
+0.042
3.03%
1 gen 1986 anni
1.345
-0.088
-6.15%
1 gen 1987 anni
1.67
+0.325
24.16%
1 gen 1988 anni
1.898
+0.228
13.64%
1 gen 1989 anni
3.08
+1.182
62.28%
1 gen 1990 anni
2.453
-0.628
-20.37%
1 gen 1991 anni
2.083
-0.37
-15.08%
1 gen 1992 anni
1.84
-0.243
-11.67%
1 gen 1993 anni
2.271
+0.431
23.45%
1 gen 1994 anni
2.182
-0.089
-3.94%
1 gen 1995 anni
1.927
-0.254
-11.66%
1 gen 1996 anni
2.293
+0.366
18.98%
1 gen 1997 anni
1.745
-0.548
-23.88%
1 gen 1998 anni
2.066
+0.321
18.38%
1 gen 1999 anni
1.772
-0.294
-14.25%
1 gen 2000 anni
1.576
-0.196
-11.08%
1 gen 2001 anni
1.592
+0.016
1.03%
1 gen 2002 anni
1.71
+0.118
7.44%
1 gen 2003 anni
1.576
-0.134
-7.83%
1 gen 2004 anni
1.327
-0.25
-15.84%
1 gen 2005 anni
1.578
+0.251
18.93%
1 gen 2006 anni
1.622
+0.044
2.8%
1 gen 2007 anni
2.369
+0.746
46.02%
1 gen 2008 anni
2.25
-0.118
-5.0%
1 gen 2009 anni
2.114
-0.136
-6.05%
1 gen 2010 anni
2.373
+0.259
12.26%
1 gen 2011 anni
1.572
-0.801
-33.76%
1 gen 2012 anni
1.867
+0.295
18.78%
1 gen 2013 anni
1.57
-0.297
-15.9%
1 gen 2014 anni
1.577
+0.006
0.4%
1 gen 2015 anni
1.846
+0.269
17.06%
1 gen 2016 anni
1.736
-0.109
-5.92%
Classificazione dei paesi secondo i statistiche attuali per anni


Commenti: