29
/it/
it
AIzaSyAYiBZKx7MnpbEhh9jyipgxe19OcubqV5w
April 1, 2024
133482
Finland
FIN
true
2
1
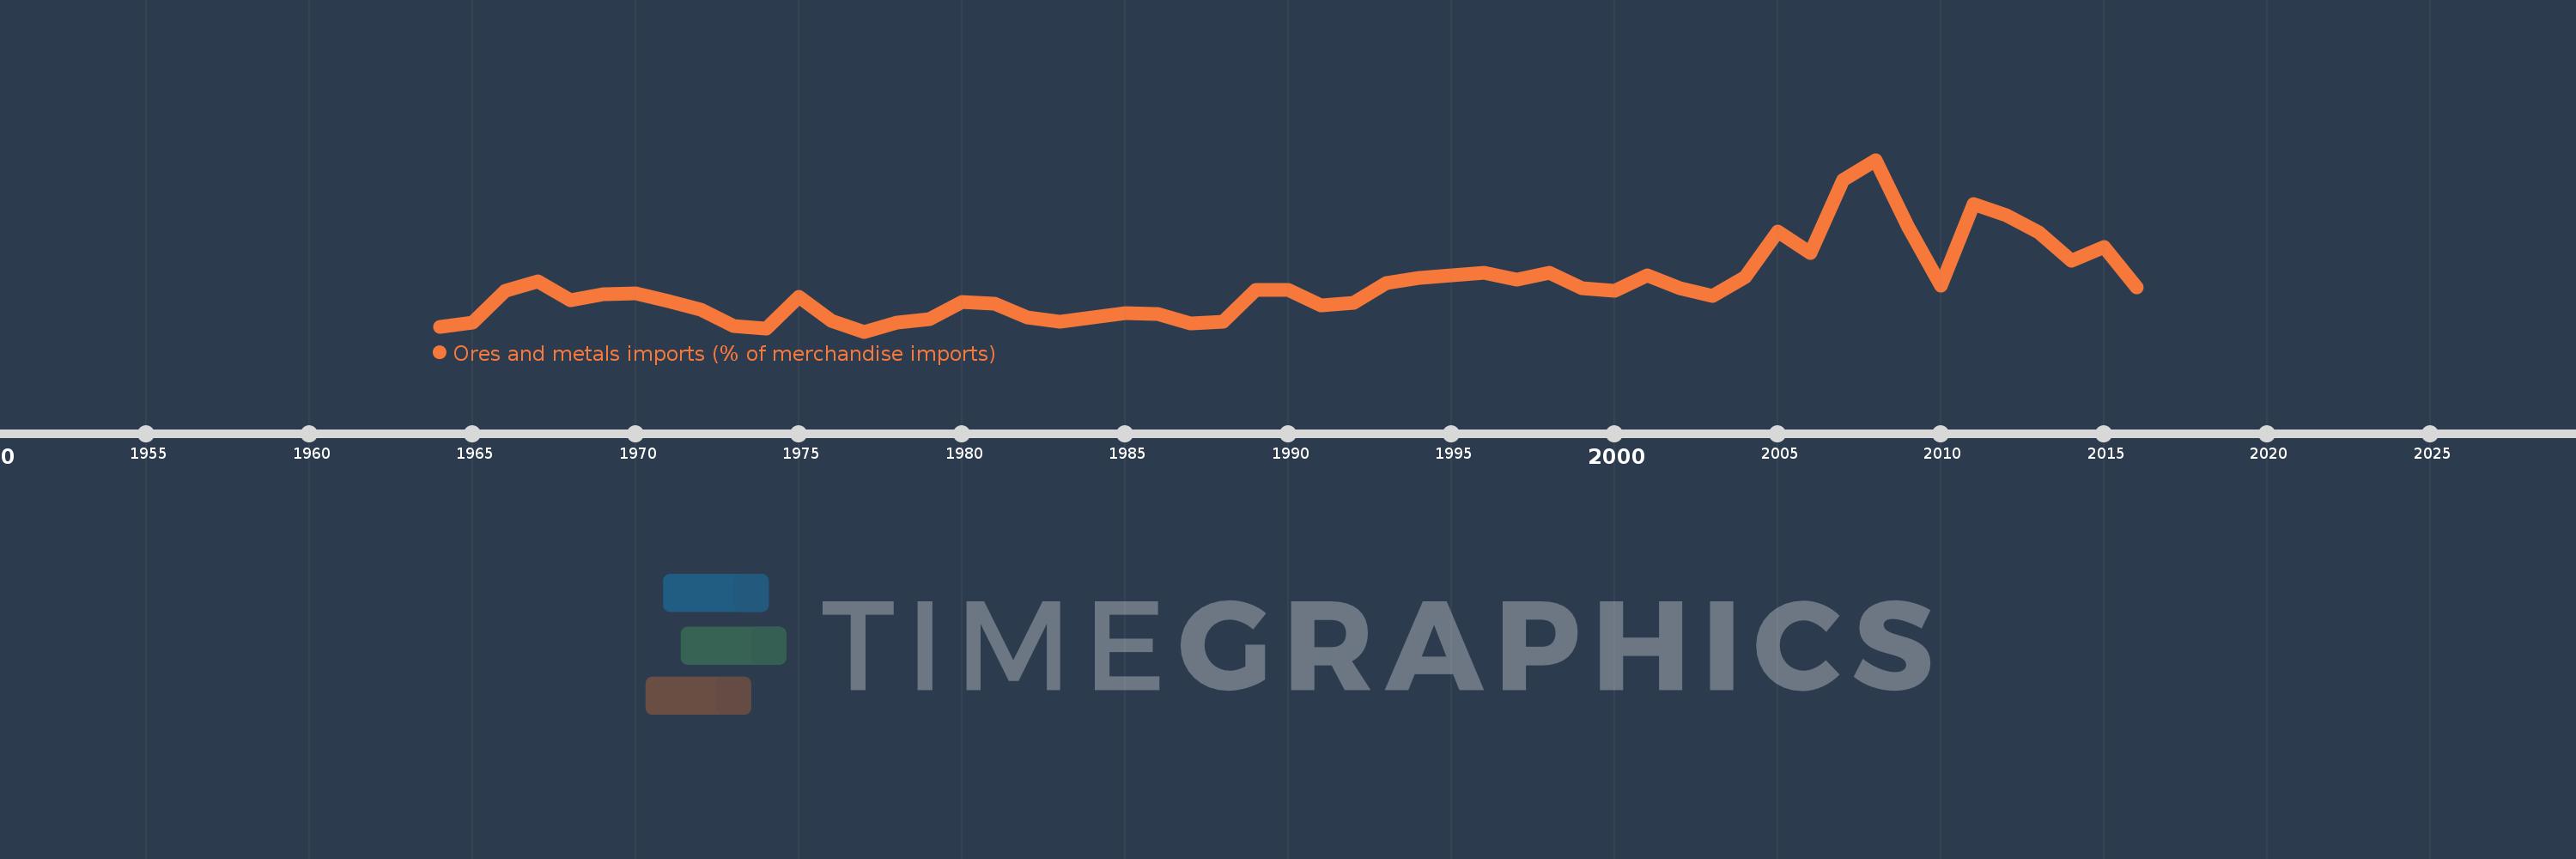
Ores and metals imports (% of merchandise imports)
2016,2015,2014,2013,2012,2011,2010,2009,2008,2007,2006,2005,2004,2003,2002,2001,2000,1999,1998,1997,1996,1995,1994,1993,1992,1991,1990,1989,1988,1987,1986,1985,1984,1983,1982,1981,1980,1979,1978,1977,1976,1975,1974,1973,1972,1971,1970,1969,1968,1967,1966,1965,1964
Queste statistiche in altri paesi:
AfghanistanAlbaniaAlgeriaAndorraAngolaAntigua and BarbudaArab WorldArgentinaArmeniaArubaAustraliaAustriaAzerbaijanBahamas, TheBahrainBangladeshBarbadosBelarusBelgiumBelizeBeninBermudaBhutanBoliviaBosnia and HerzegovinaBotswanaBrazilBrunei DarussalamBulgariaBurkina FasoBurundiCabo VerdeCambodiaCameroonCanadaCaribbean small statesCayman IslandsCentral African RepublicCentral Europe and the BalticsChadChileChinaColombiaComorosCongo, Dem. Rep.Congo, Rep.Costa RicaCote d'IvoireCroatiaCubaCyprusCzech RepublicDenmarkDjiboutiDominicaDominican RepublicEarly-demographic dividendEast Asia & PacificEast Asia & Pacific (excluding high income)East Asia & Pacific (IDA & IBRD countries)EcuadorEgypt, Arab Rep.El SalvadorEquatorial GuineaEritreaEstoniaEthiopiaEuro areaEurope & Central AsiaEurope & Central Asia (excluding high income)Europe & Central Asia (IDA & IBRD countries)European UnionFaroe IslandsFijiFinlandFragile and conflict affected situationsFranceFrench PolynesiaGabonGambia, TheGeorgiaGermanyGhanaGreeceGreenlandGrenadaGuatemalaGuineaGuinea-BissauGuyanaHaitiHeavily indebted poor countries (HIPC)High incomeHondurasHong Kong SAR, ChinaHungaryIBRD onlyIcelandIDA & IBRD totalIDA blendIDA onlyIDA totalIndiaIndonesiaIran, Islamic Rep.IraqIrelandIsraelItalyJamaicaJapanJordanKazakhstanKenyaKiribatiKorea, Rep.KuwaitKyrgyz RepublicLao PDRLate-demographic dividendLatin America & Caribbean Latin America & Caribbean (excluding high income)Latin America & the Caribbean (IDA & IBRD countries)LatviaLeast developed countries: UN classificationLebanonLesothoLiberiaLibyaLithuaniaLow & middle incomeLow incomeLower middle incomeLuxembourgMacao SAR, ChinaMacedonia, FYRMadagascarMalawiMalaysiaMaldivesMaliMaltaMauritaniaMauritiusMexicoMiddle East & North AfricaMiddle East & North Africa (excluding high income)Middle East & North Africa (IDA & IBRD countries)Middle incomeMoldovaMongoliaMoroccoMozambiqueMyanmarNamibiaNepalNetherlandsNew CaledoniaNew ZealandNicaraguaNigerNigeriaNorth AmericaNorwayOECD membersOmanOther small statesPacific island small statesPakistanPalauPanamaPapua New GuineaParaguayPeruPhilippinesPolandPortugalPost-demographic dividendPre-demographic dividendQatarRomaniaRussian FederationRwandaSamoaSao Tome and PrincipeSaudi ArabiaSenegalSerbiaSeychellesSierra LeoneSingaporeSlovak RepublicSloveniaSmall statesSolomon IslandsSomaliaSouth AfricaSouth AsiaSouth Asia (IDA & IBRD)SpainSri LankaSt. Kitts and NevisSt. LuciaSt. Vincent and the GrenadinesSub-Saharan Africa Sub-Saharan Africa (excluding high income)Sub-Saharan Africa (IDA & IBRD countries)SudanSurinameSwazilandSwedenSwitzerlandSyrian Arab RepublicTajikistanTanzaniaThailandTimor-LesteTogoTongaTrinidad and TobagoTunisiaTurkeyTurkmenistanTurks and Caicos IslandsTuvaluUgandaUkraineUnited Arab EmiratesUnited KingdomUnited StatesUpper middle incomeUruguayVanuatuVenezuela, RBVietnamVirgin Islands (U.S.)WorldYemen, Rep.ZambiaZimbabwe Linea del tempo:
Questa scala temporale mostra un grafico dal 1964 anno al 2016 anno. Finland. I dati fino ad 1963 anno non disponibili. Il numero di osservazioni attuali secondo i date: 53.
La fonte (nome):
Indicatori dello sviluppo mondiale
La fonte (organizzazione):
World Bank staff estimates from the Comtrade database maintained by the United Nations Statistics Division.
Categorie:
Energy & Mining, Private Sector, Trade
sono stati aggiornati
23 apr 2017 anni
Indicatori delle variazioni dei valori per anni
Minima:
3.532
1 gen 1977 anni
Massimo:
9.86
1 gen 2008 anni
Alla data di osservazione
Valore
Variazione assoluta
La variazione rispetto al valore precedente
1 gen 1964 anni
3.72
+3.72
0.0%
1 gen 1965 anni
3.88
+0.16
4.3%
1 gen 1966 anni
5.05
+1.17
30.15%
1 gen 1967 anni
5.392
+0.342
6.76%
1 gen 1968 anni
4.691
-0.701
-12.99%
1 gen 1969 anni
4.915
+0.224
4.78%
1 gen 1970 anni
4.938
+0.022
0.46%
1 gen 1971 anni
4.647
-0.291
-5.89%
1 gen 1972 anni
4.333
-0.314
-6.76%
1 gen 1973 anni
3.75
-0.583
-13.45%
1 gen 1974 anni
3.657
-0.093
-2.49%
1 gen 1975 anni
4.8
+1.143
31.26%
1 gen 1976 anni
3.943
-0.857
-17.85%
1 gen 1977 anni
3.532
-0.411
-10.42%
1 gen 1978 anni
3.852
+0.32
9.05%
1 gen 1979 anni
3.984
+0.132
3.42%
1 gen 1980 anni
4.618
+0.634
15.92%
1 gen 1981 anni
4.57
-0.048
-1.05%
1 gen 1982 anni
4.04
-0.53
-11.59%
1 gen 1983 anni
3.909
-0.131
-3.25%
1 gen 1984 anni
4.058
+0.149
3.82%
1 gen 1985 anni
4.209
+0.151
3.72%
1 gen 1986 anni
4.18
-0.029
-0.7%
1 gen 1987 anni
3.83
-0.35
-8.38%
1 gen 1988 anni
3.897
+0.067
1.74%
1 gen 1989 anni
5.064
+1.168
29.97%
1 gen 1990 anni
5.052
-0.012
-0.24%
1 gen 1991 anni
4.482
-0.57
-11.28%
1 gen 1992 anni
4.594
+0.112
2.49%
1 gen 1993 anni
5.317
+0.723
15.75%
1 gen 1994 anni
5.525
+0.208
3.91%
1 gen 1995 anni
5.614
+0.089
1.61%
1 gen 1996 anni
5.688
+0.074
1.31%
1 gen 1997 anni
5.458
-0.23
-4.04%
1 gen 1998 anni
5.695
+0.237
4.34%
1 gen 1999 anni
5.12
-0.575
-10.09%
1 gen 2000 anni
5.034
-0.087
-1.69%
1 gen 2001 anni
5.598
+0.564
11.2%
1 gen 2002 anni
5.118
-0.479
-8.56%
1 gen 2003 anni
4.834
-0.284
-5.55%
1 gen 2004 anni
5.551
+0.716
14.81%
1 gen 2005 anni
7.232
+1.681
30.29%
1 gen 2006 anni
6.433
-0.799
-11.04%
1 gen 2007 anni
9.131
+2.698
41.94%
1 gen 2008 anni
9.86
+0.729
7.98%
1 gen 2009 anni
7.376
-2.483
-25.19%
1 gen 2010 anni
5.21
-2.166
-29.37%
1 gen 2011 anni
8.238
+3.028
58.11%
1 gen 2012 anni
7.832
-0.406
-4.92%
1 gen 2013 anni
7.201
-0.631
-8.06%
1 gen 2014 anni
6.141
-1.06
-14.72%
1 gen 2015 anni
6.661
+0.52
8.47%
1 gen 2016 anni
5.156
-1.505
-22.6%
Classificazione dei paesi secondo i statistiche attuali per anni


Commenti: