29
/it/
it
AIzaSyAYiBZKx7MnpbEhh9jyipgxe19OcubqV5w
April 1, 2024
32976
Europe & Central Asia (IDA & IBRD countries)
TEC
false
2
1
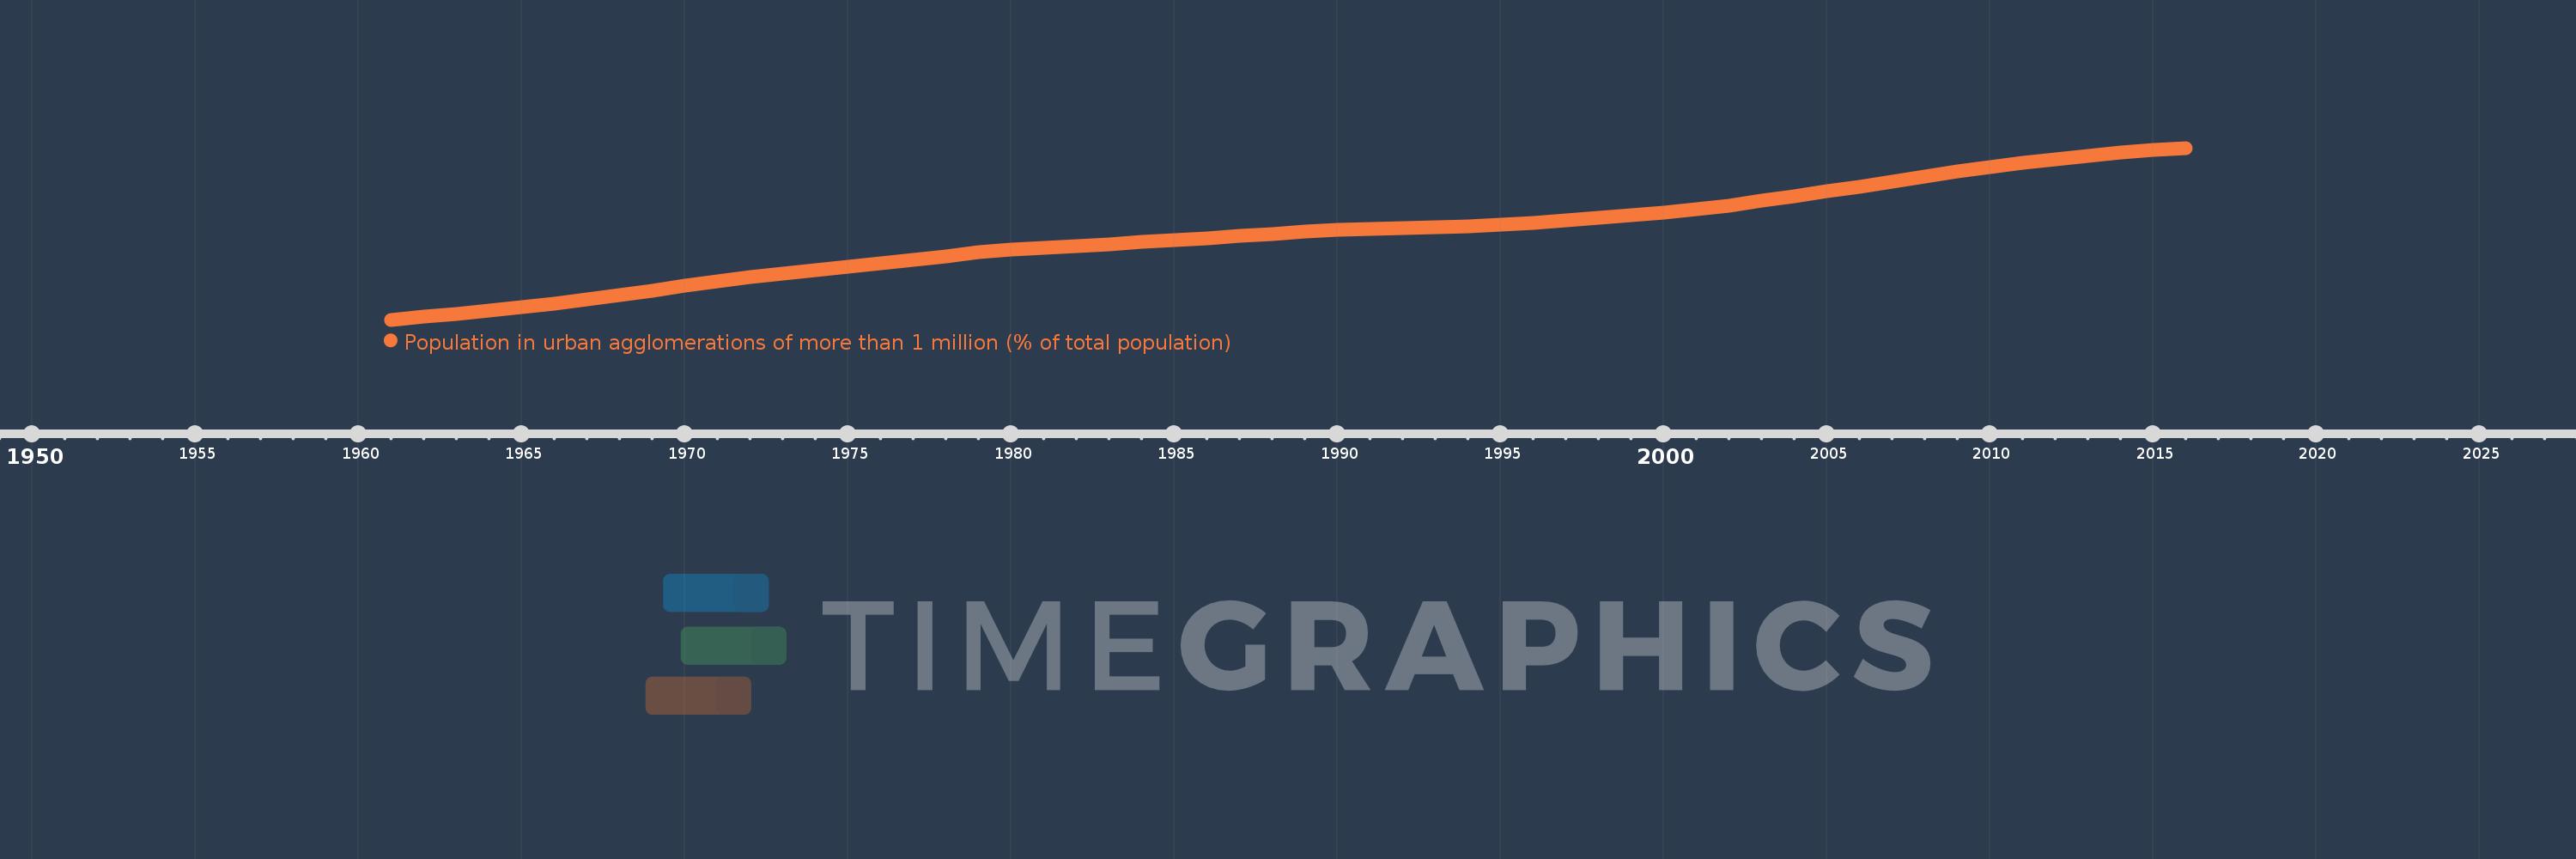
Population in urban agglomerations of more than 1 million (% of total population)
2016,2015,2014,2013,2012,2011,2010,2009,2008,2007,2006,2005,2004,2003,2002,2001,2000,1999,1998,1997,1996,1995,1994,1993,1992,1991,1990,1989,1988,1987,1986,1985,1984,1983,1982,1981,1980,1979,1978,1977,1976,1975,1974,1973,1972,1971,1970,1969,1968,1967,1966,1965,1964,1963,1962,1961
Queste statistiche in altri paesi:
Linea del tempo:
Questa scala temporale mostra un grafico dal 1961 anno al 2016 anno. Europe & Central Asia (IDA & IBRD countries). I dati fino ad 1960 anno non disponibili. Il numero di osservazioni attuali secondo i date: 56.
La fonte (nome):
Indicatori dello sviluppo mondiale
La fonte (organizzazione):
United Nations, World Urbanization Prospects.
Categorie:
Climate Change, Urban Development
sono stati aggiornati
23 apr 2017 anni
Indicatori delle variazioni dei valori per anni
Minima:
10.836
1 gen 1961 anni
Massimo:
19.586
1 gen 2016 anni
Alla data di osservazione
Valore
Variazione assoluta
La variazione rispetto al valore precedente
1 gen 1961 anni
10.836
+10.836
0.0%
1 gen 1962 anni
10.985
+0.149
1.38%
1 gen 1963 anni
11.146
+0.161
1.46%
1 gen 1964 anni
11.312
+0.166
1.49%
1 gen 1965 anni
11.486
+0.175
1.55%
1 gen 1966 anni
11.676
+0.19
1.65%
1 gen 1967 anni
11.89
+0.214
1.83%
1 gen 1968 anni
12.104
+0.214
1.8%
1 gen 1969 anni
12.331
+0.226
1.87%
1 gen 1970 anni
12.569
+0.239
1.94%
1 gen 1971 anni
12.806
+0.237
1.89%
1 gen 1972 anni
12.996
+0.19
1.48%
1 gen 1973 anni
13.166
+0.17
1.31%
1 gen 1974 anni
13.346
+0.18
1.36%
1 gen 1975 anni
13.531
+0.185
1.38%
1 gen 1976 anni
13.721
+0.19
1.4%
1 gen 1977 anni
13.902
+0.181
1.32%
1 gen 1978 anni
14.079
+0.177
1.28%
1 gen 1979 anni
14.258
+0.179
1.27%
1 gen 1980 anni
14.398
+0.139
0.98%
1 gen 1981 anni
14.483
+0.085
0.59%
1 gen 1982 anni
14.575
+0.092
0.64%
1 gen 1983 anni
14.678
+0.103
0.71%
1 gen 1984 anni
14.787
+0.109
0.74%
1 gen 1985 anni
14.891
+0.105
0.71%
1 gen 1986 anni
15.001
+0.11
0.74%
1 gen 1987 anni
15.108
+0.107
0.71%
1 gen 1988 anni
15.215
+0.107
0.71%
1 gen 1989 anni
15.333
+0.118
0.78%
1 gen 1990 anni
15.412
+0.079
0.52%
1 gen 1991 anni
15.473
+0.06
0.39%
1 gen 1992 anni
15.526
+0.054
0.35%
1 gen 1993 anni
15.563
+0.036
0.23%
1 gen 1994 anni
15.594
+0.032
0.2%
1 gen 1995 anni
15.666
+0.071
0.46%
1 gen 1996 anni
15.766
+0.1
0.64%
1 gen 1997 anni
15.887
+0.122
0.77%
1 gen 1998 anni
16.026
+0.139
0.88%
1 gen 1999 anni
16.159
+0.133
0.83%
1 gen 2000 anni
16.297
+0.138
0.85%
1 gen 2001 anni
16.461
+0.164
1.01%
1 gen 2002 anni
16.657
+0.196
1.19%
1 gen 2003 anni
16.888
+0.231
1.39%
1 gen 2004 anni
17.126
+0.239
1.41%
1 gen 2005 anni
17.368
+0.242
1.41%
1 gen 2006 anni
17.615
+0.247
1.42%
1 gen 2007 anni
17.867
+0.252
1.43%
1 gen 2008 anni
18.125
+0.258
1.44%
1 gen 2009 anni
18.372
+0.247
1.37%
1 gen 2010 anni
18.598
+0.225
1.23%
1 gen 2011 anni
18.822
+0.225
1.21%
1 gen 2012 anni
19.019
+0.197
1.04%
1 gen 2013 anni
19.187
+0.168
0.89%
1 gen 2014 anni
19.337
+0.149
0.78%
1 gen 2015 anni
19.491
+0.154
0.8%
1 gen 2016 anni
19.586
+0.095
0.49%
Classificazione dei paesi secondo i statistiche attuali per anni


Commenti: