29
/it/
it
AIzaSyAYiBZKx7MnpbEhh9jyipgxe19OcubqV5w
April 1, 2024
196069
Mexico
MEX
true
2
1
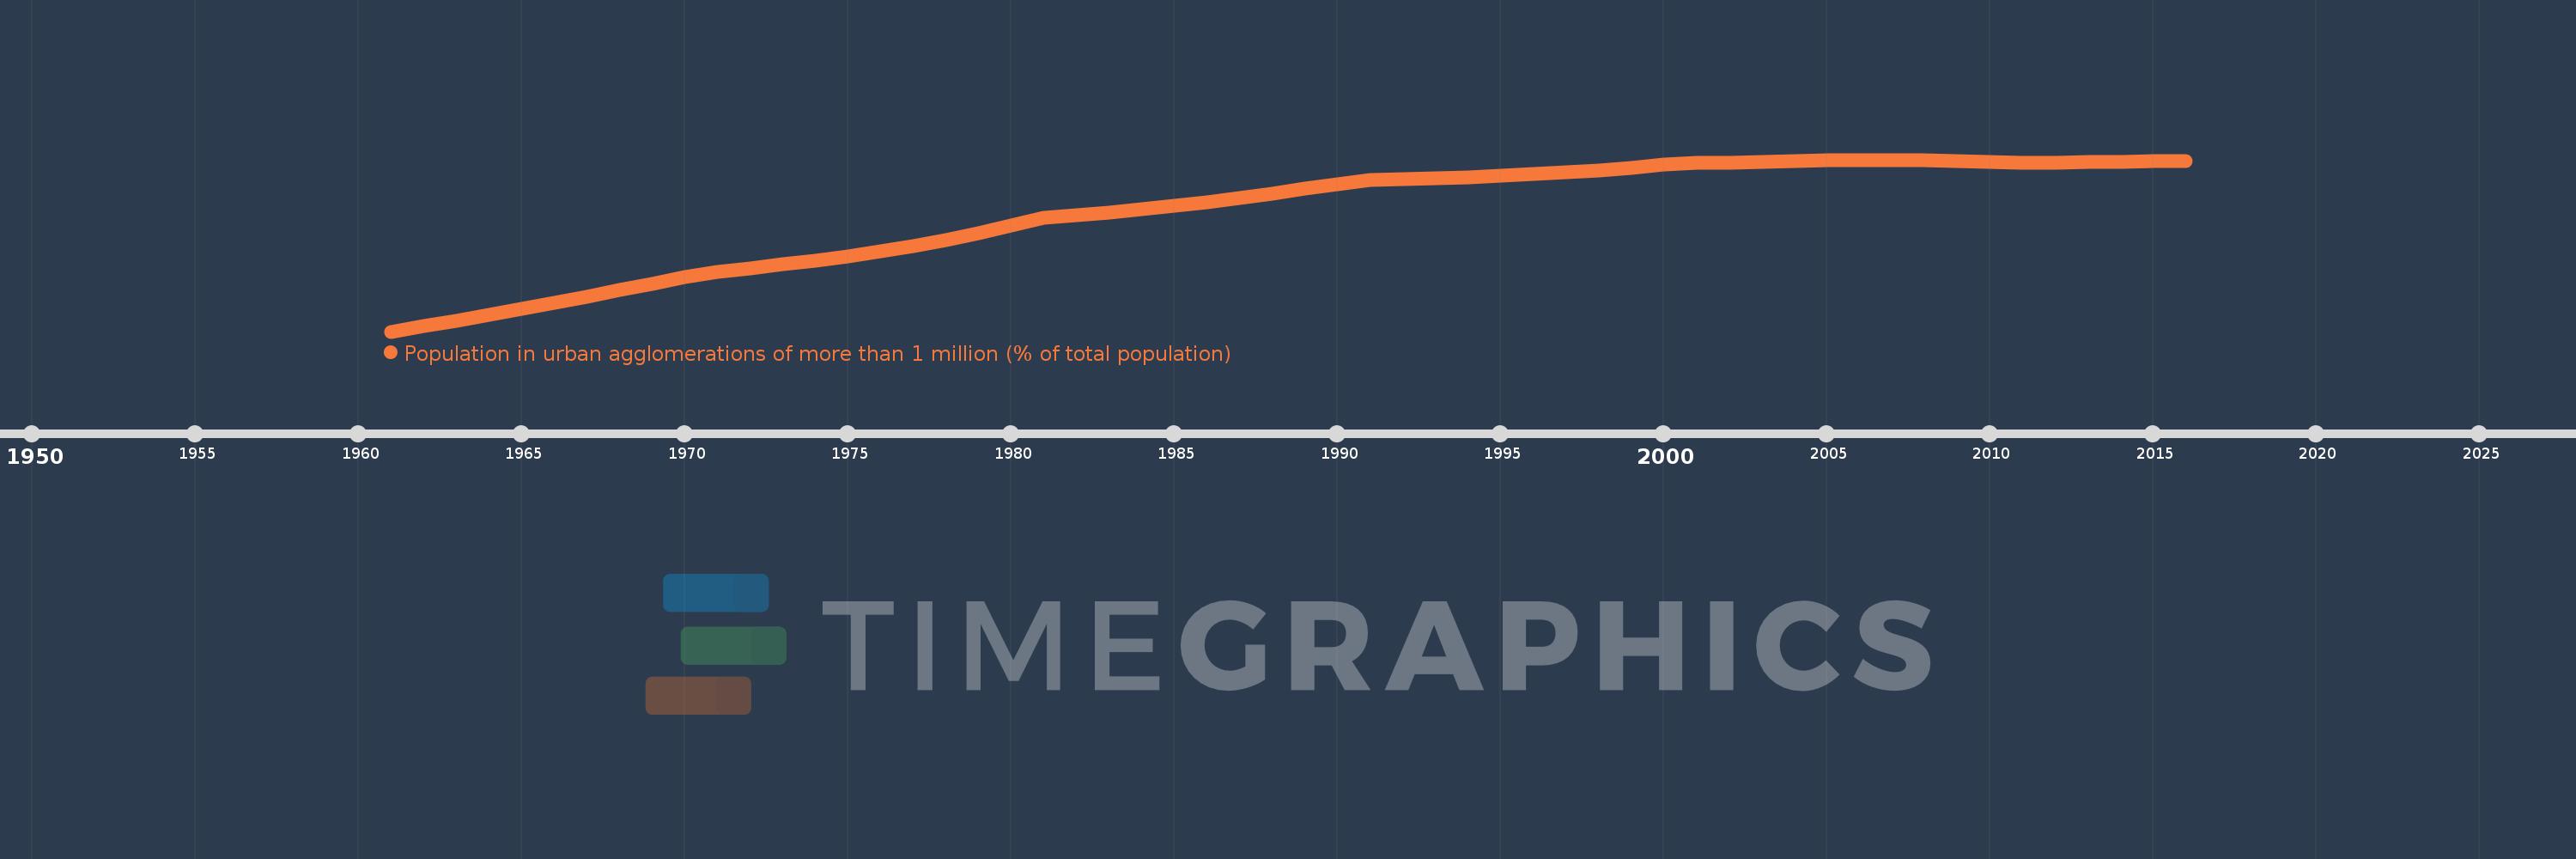
Population in urban agglomerations of more than 1 million (% of total population)
2016,2015,2014,2013,2012,2011,2010,2009,2008,2007,2006,2005,2004,2003,2002,2001,2000,1999,1998,1997,1996,1995,1994,1993,1992,1991,1990,1989,1988,1987,1986,1985,1984,1983,1982,1981,1980,1979,1978,1977,1976,1975,1974,1973,1972,1971,1970,1969,1968,1967,1966,1965,1964,1963,1962,1961
Queste statistiche in altri paesi:
Linea del tempo:
Questa scala temporale mostra un grafico dal 1961 anno al 2016 anno. Mexico. I dati fino ad 1960 anno non disponibili. Il numero di osservazioni attuali secondo i date: 56.
La fonte (nome):
Indicatori dello sviluppo mondiale
La fonte (organizzazione):
United Nations, World Urbanization Prospects.
Categorie:
Climate Change, Urban Development
sono stati aggiornati
23 apr 2017 anni
Indicatori delle variazioni dei valori per anni
Minima:
24.51
1 gen 1961 anni
Massimo:
37.516
1 gen 2006 anni
Alla data di osservazione
Valore
Variazione assoluta
La variazione rispetto al valore precedente
1 gen 1961 anni
24.51
+24.51
0.0%
1 gen 1962 anni
24.916
+0.406
1.66%
1 gen 1963 anni
25.334
+0.418
1.68%
1 gen 1964 anni
25.764
+0.43
1.7%
1 gen 1965 anni
26.209
+0.445
1.73%
1 gen 1966 anni
26.664
+0.456
1.74%
1 gen 1967 anni
27.14
+0.475
1.78%
1 gen 1968 anni
27.632
+0.493
1.82%
1 gen 1969 anni
28.137
+0.504
1.83%
1 gen 1970 anni
28.637
+0.5
1.78%
1 gen 1971 anni
29.043
+0.407
1.42%
1 gen 1972 anni
29.317
+0.274
0.94%
1 gen 1973 anni
29.59
+0.273
0.93%
1 gen 1974 anni
29.874
+0.284
0.96%
1 gen 1975 anni
30.194
+0.32
1.07%
1 gen 1976 anni
30.563
+0.369
1.22%
1 gen 1977 anni
30.986
+0.423
1.39%
1 gen 1978 anni
31.456
+0.47
1.52%
1 gen 1979 anni
31.978
+0.521
1.66%
1 gen 1980 anni
32.547
+0.57
1.78%
1 gen 1981 anni
33.13
+0.583
1.79%
1 gen 1982 anni
33.305
+0.175
0.53%
1 gen 1983 anni
33.518
+0.213
0.64%
1 gen 1984 anni
33.763
+0.245
0.73%
1 gen 1985 anni
34.035
+0.272
0.81%
1 gen 1986 anni
34.325
+0.29
0.85%
1 gen 1987 anni
34.637
+0.312
0.91%
1 gen 1988 anni
34.97
+0.333
0.96%
1 gen 1989 anni
35.324
+0.354
1.01%
1 gen 1990 anni
35.692
+0.369
1.04%
1 gen 1991 anni
35.981
+0.288
0.81%
1 gen 1992 anni
36.045
+0.064
0.18%
1 gen 1993 anni
36.117
+0.072
0.2%
1 gen 1994 anni
36.197
+0.081
0.22%
1 gen 1995 anni
36.296
+0.098
0.27%
1 gen 1996 anni
36.415
+0.12
0.33%
1 gen 1997 anni
36.555
+0.14
0.38%
1 gen 1998 anni
36.712
+0.157
0.43%
1 gen 1999 anni
36.899
+0.187
0.51%
1 gen 2000 anni
37.126
+0.228
0.62%
1 gen 2001 anni
37.286
+0.159
0.43%
1 gen 2002 anni
37.3
+0.014
0.04%
1 gen 2003 anni
37.356
+0.056
0.15%
1 gen 2004 anni
37.43
+0.074
0.2%
1 gen 2005 anni
37.491
+0.061
0.16%
1 gen 2006 anni
37.516
+0.026
0.07%
1 gen 2007 anni
37.502
-0.014
-0.04%
1 gen 2008 anni
37.457
-0.045
-0.12%
1 gen 2009 anni
37.398
-0.059
-0.16%
1 gen 2010 anni
37.346
-0.052
-0.14%
1 gen 2011 anni
37.318
-0.028
-0.07%
1 gen 2012 anni
37.317
-0.001
0.0%
1 gen 2013 anni
37.338
+0.021
0.06%
1 gen 2014 anni
37.379
+0.041
0.11%
1 gen 2015 anni
37.435
+0.056
0.15%
1 gen 2016 anni
37.449
+0.014
0.04%
Classificazione dei paesi secondo i statistiche attuali per anni


Commenti: