29
/it/
it
AIzaSyAYiBZKx7MnpbEhh9jyipgxe19OcubqV5w
April 1, 2024
269854
Turkey
TUR
true
2
1
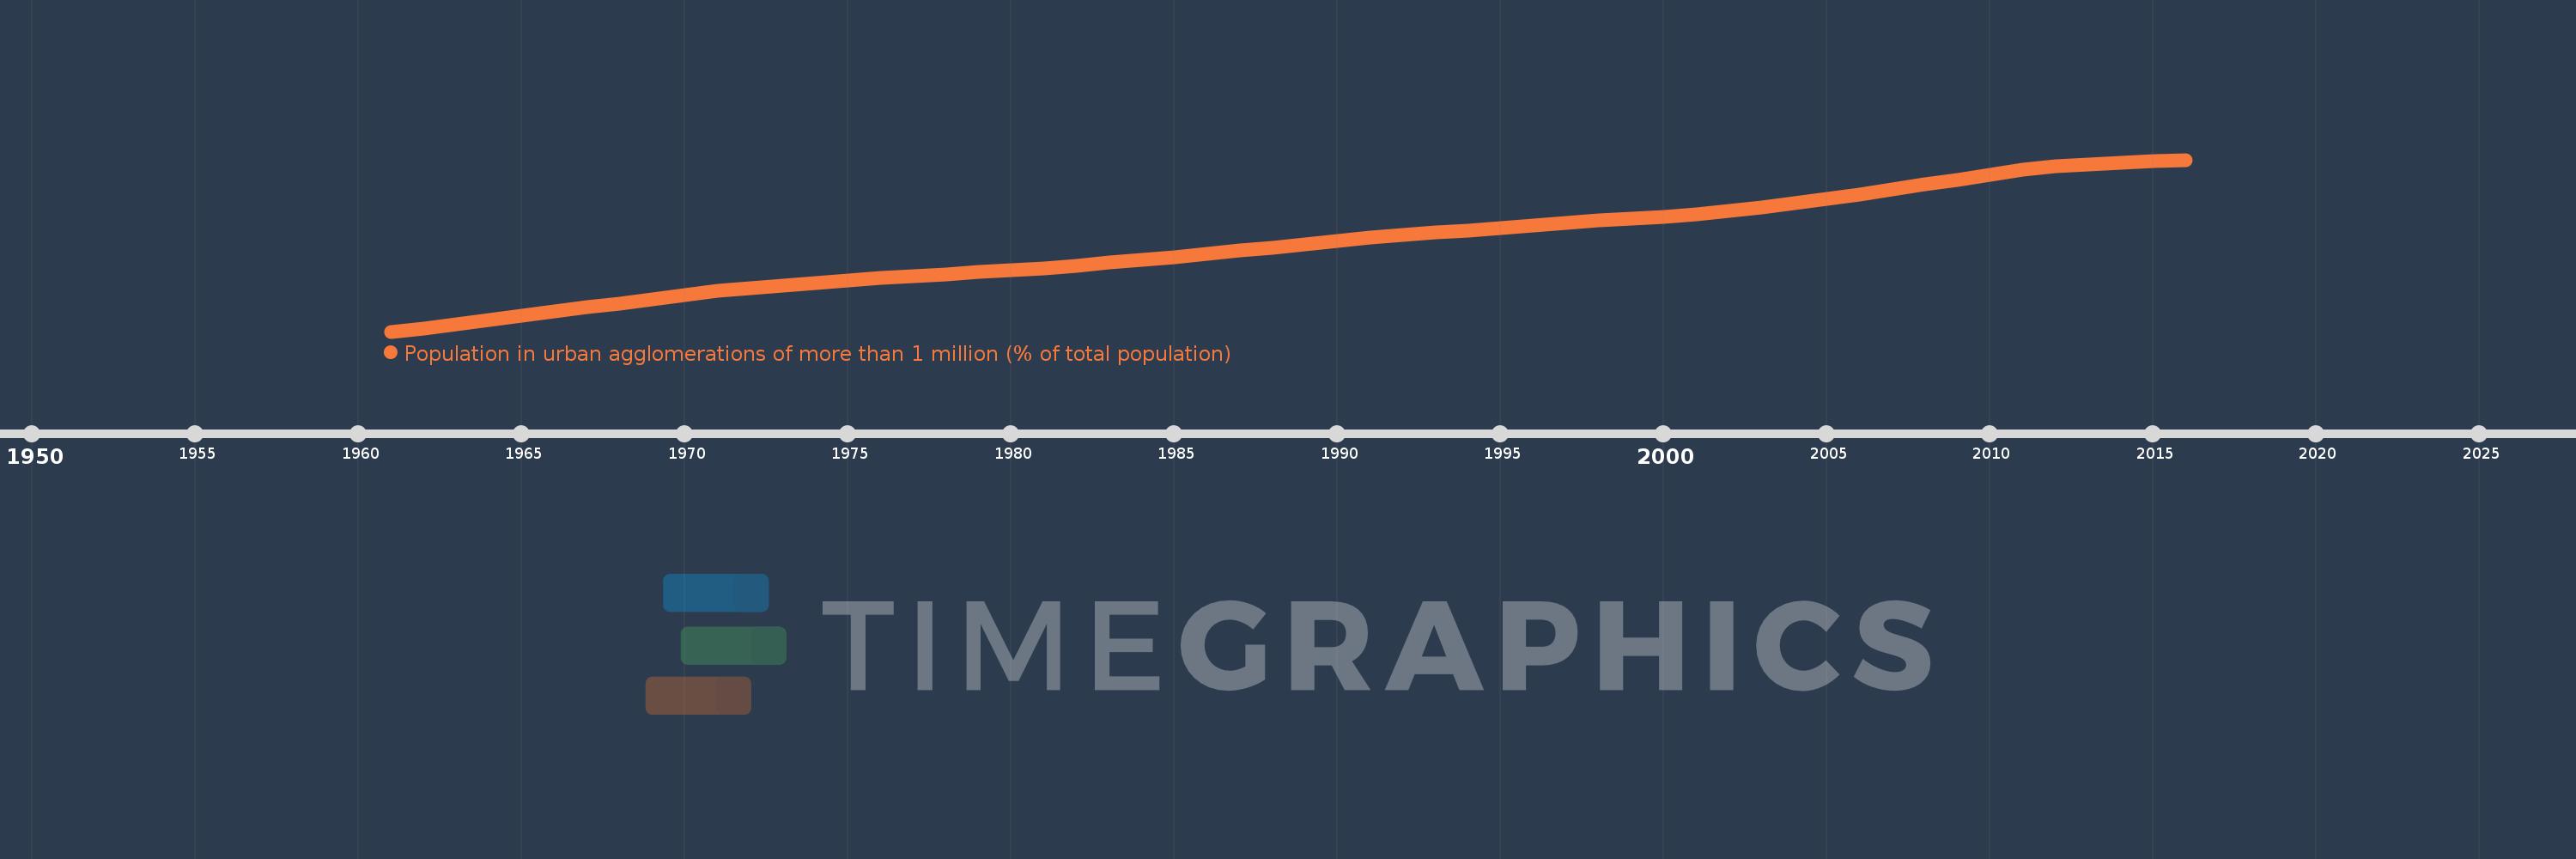
Population in urban agglomerations of more than 1 million (% of total population)
2016,2015,2014,2013,2012,2011,2010,2009,2008,2007,2006,2005,2004,2003,2002,2001,2000,1999,1998,1997,1996,1995,1994,1993,1992,1991,1990,1989,1988,1987,1986,1985,1984,1983,1982,1981,1980,1979,1978,1977,1976,1975,1974,1973,1972,1971,1970,1969,1968,1967,1966,1965,1964,1963,1962,1961
Queste statistiche in altri paesi:
Linea del tempo:
Questa scala temporale mostra un grafico dal 1961 anno al 2016 anno. Turkey. I dati fino ad 1960 anno non disponibili. Il numero di osservazioni attuali secondo i date: 56.
La fonte (nome):
Indicatori dello sviluppo mondiale
La fonte (organizzazione):
United Nations, World Urbanization Prospects.
Categorie:
Climate Change, Urban Development
sono stati aggiornati
23 apr 2017 anni
Indicatori delle variazioni dei valori per anni
Minima:
12.156
1 gen 1961 anni
Massimo:
37.502
1 gen 2016 anni
Alla data di osservazione
Valore
Variazione assoluta
La variazione rispetto al valore precedente
1 gen 1961 anni
12.156
+12.156
0.0%
1 gen 1962 anni
12.614
+0.458
3.77%
1 gen 1963 anni
13.196
+0.583
4.62%
1 gen 1964 anni
13.813
+0.617
4.67%
1 gen 1965 anni
14.467
+0.653
4.73%
1 gen 1966 anni
15.153
+0.686
4.74%
1 gen 1967 anni
15.747
+0.594
3.92%
1 gen 1968 anni
16.312
+0.565
3.59%
1 gen 1969 anni
16.908
+0.595
3.65%
1 gen 1970 anni
17.527
+0.619
3.66%
1 gen 1971 anni
18.174
+0.647
3.69%
1 gen 1972 anni
18.61
+0.437
2.4%
1 gen 1973 anni
18.946
+0.336
1.8%
1 gen 1974 anni
19.288
+0.341
1.8%
1 gen 1975 anni
19.644
+0.356
1.85%
1 gen 1976 anni
20.018
+0.374
1.9%
1 gen 1977 anni
20.328
+0.31
1.55%
1 gen 1978 anni
20.613
+0.285
1.4%
1 gen 1979 anni
20.911
+0.298
1.45%
1 gen 1980 anni
21.215
+0.304
1.45%
1 gen 1981 anni
21.522
+0.308
1.45%
1 gen 1982 anni
21.893
+0.371
1.72%
1 gen 1983 anni
22.296
+0.403
1.84%
1 gen 1984 anni
22.713
+0.417
1.87%
1 gen 1985 anni
23.156
+0.444
1.95%
1 gen 1986 anni
23.631
+0.475
2.05%
1 gen 1987 anni
24.073
+0.442
1.87%
1 gen 1988 anni
24.518
+0.444
1.85%
1 gen 1989 anni
24.994
+0.477
1.94%
1 gen 1990 anni
25.497
+0.503
2.01%
1 gen 1991 anni
26.027
+0.53
2.08%
1 gen 1992 anni
26.409
+0.383
1.47%
1 gen 1993 anni
26.735
+0.326
1.23%
1 gen 1994 anni
27.074
+0.338
1.27%
1 gen 1995 anni
27.423
+0.349
1.29%
1 gen 1996 anni
27.778
+0.356
1.3%
1 gen 1997 anni
28.14
+0.362
1.3%
1 gen 1998 anni
28.506
+0.366
1.3%
1 gen 1999 anni
28.829
+0.323
1.13%
1 gen 2000 anni
29.125
+0.296
1.03%
1 gen 2001 anni
29.437
+0.311
1.07%
1 gen 2002 anni
29.921
+0.485
1.65%
1 gen 2003 anni
30.497
+0.576
1.93%
1 gen 2004 anni
31.097
+0.599
1.96%
1 gen 2005 anni
31.727
+0.63
2.03%
1 gen 2006 anni
32.386
+0.66
2.08%
1 gen 2007 anni
33.089
+0.702
2.17%
1 gen 2008 anni
33.829
+0.74
2.24%
1 gen 2009 anni
34.585
+0.756
2.23%
1 gen 2010 anni
35.316
+0.732
2.12%
1 gen 2011 anni
36.007
+0.69
1.95%
1 gen 2012 anni
36.538
+0.531
1.48%
1 gen 2013 anni
36.84
+0.302
0.83%
1 gen 2014 anni
37.052
+0.212
0.58%
1 gen 2015 anni
37.314
+0.262
0.71%
1 gen 2016 anni
37.502
+0.188
0.5%
Classificazione dei paesi secondo i statistiche attuali per anni


Commenti: