29
/it/
it
AIzaSyAYiBZKx7MnpbEhh9jyipgxe19OcubqV5w
April 1, 2024
208330
Netherlands
NLD
true
2
1
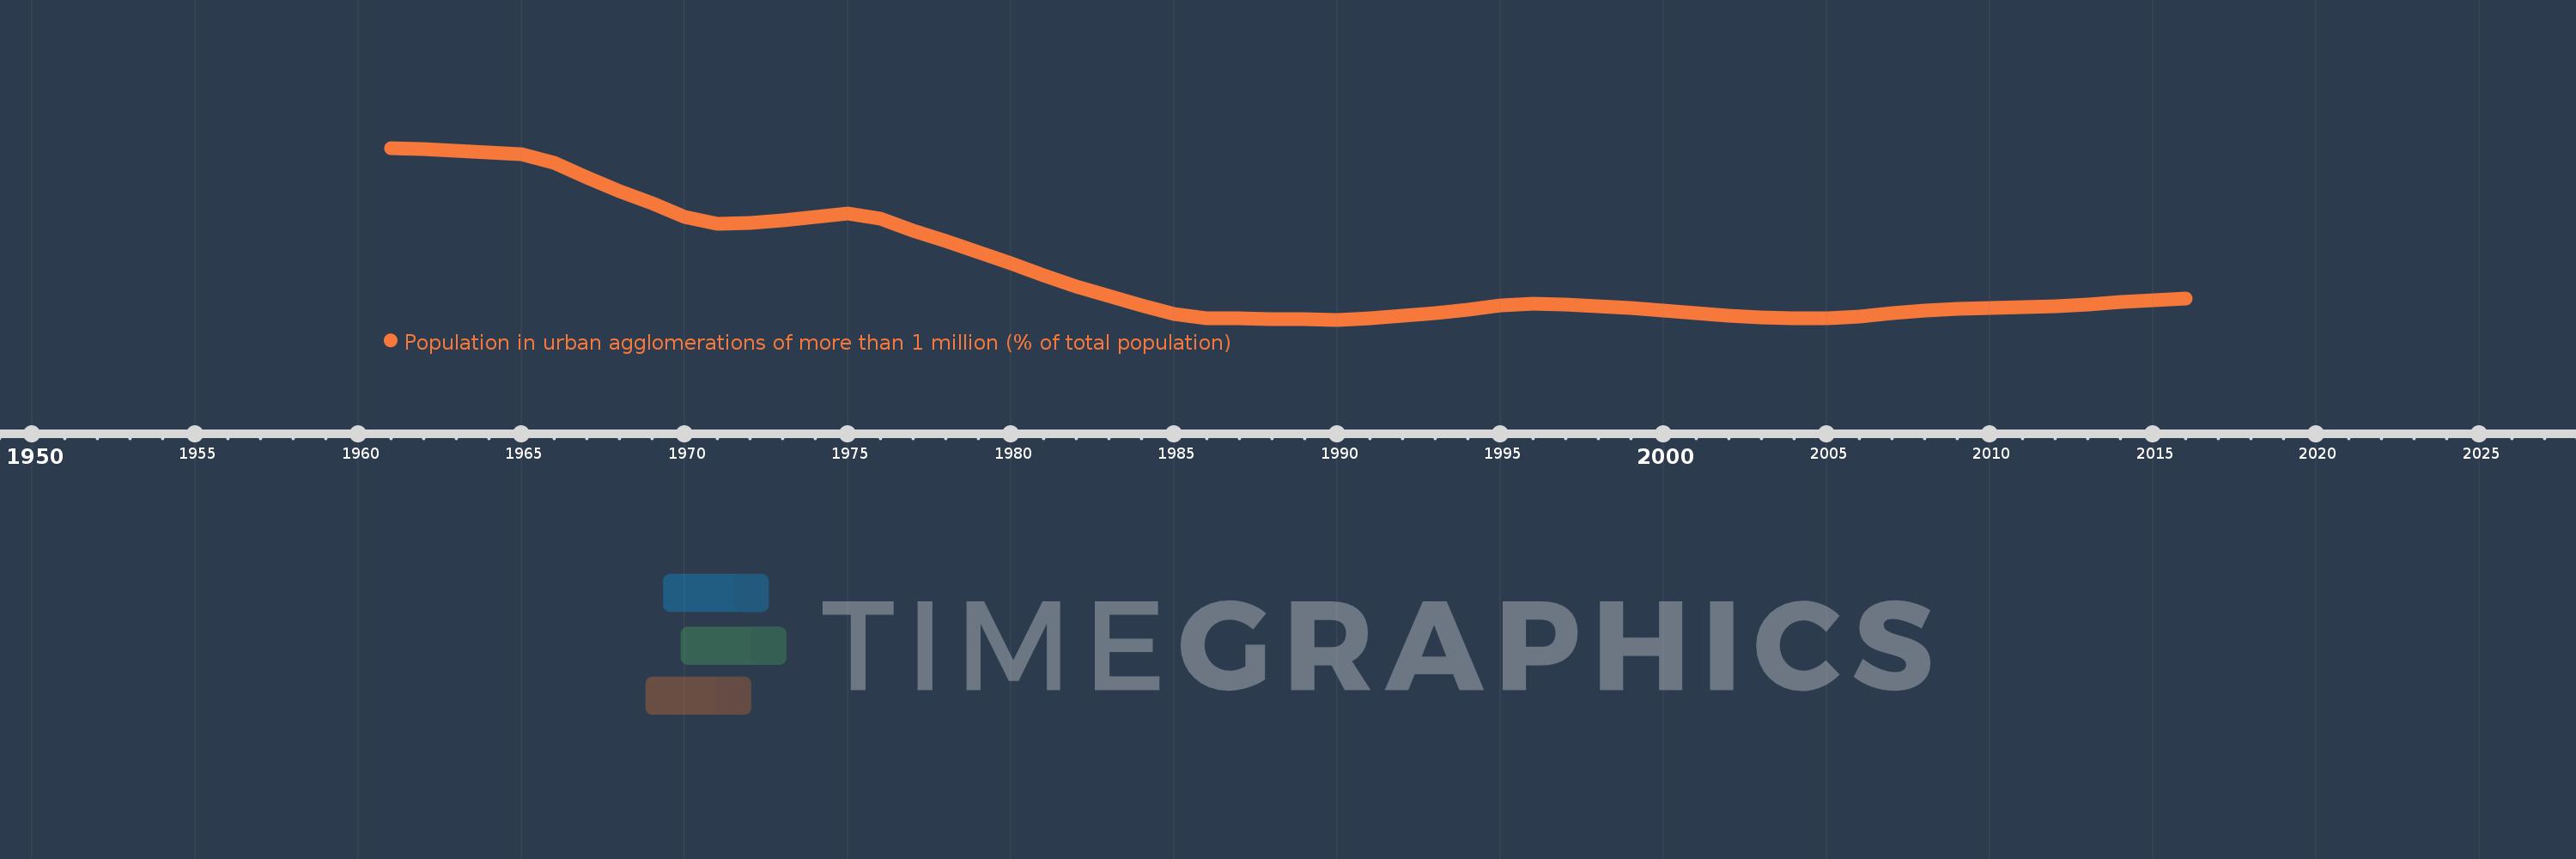
Population in urban agglomerations of more than 1 million (% of total population)
2016,2015,2014,2013,2012,2011,2010,2009,2008,2007,2006,2005,2004,2003,2002,2001,2000,1999,1998,1997,1996,1995,1994,1993,1992,1991,1990,1989,1988,1987,1986,1985,1984,1983,1982,1981,1980,1979,1978,1977,1976,1975,1974,1973,1972,1971,1970,1969,1968,1967,1966,1965,1964,1963,1962,1961
Queste statistiche in altri paesi:
Linea del tempo:
Questa scala temporale mostra un grafico dal 1961 anno al 2016 anno. Netherlands. I dati fino ad 1960 anno non disponibili. Il numero di osservazioni attuali secondo i date: 56.
La fonte (nome):
Indicatori dello sviluppo mondiale
La fonte (organizzazione):
United Nations, World Urbanization Prospects.
Categorie:
Climate Change, Urban Development
sono stati aggiornati
23 apr 2017 anni
Indicatori delle variazioni dei valori per anni
Minima:
6.246
1 gen 1990 anni
Massimo:
7.794
1 gen 1961 anni
Alla data di osservazione
Valore
Variazione assoluta
La variazione rispetto al valore precedente
1 gen 1961 anni
7.794
+7.794
0.0%
1 gen 1962 anni
7.784
-0.01
-0.13%
1 gen 1963 anni
7.765
-0.018
-0.24%
1 gen 1964 anni
7.752
-0.013
-0.16%
1 gen 1965 anni
7.741
-0.012
-0.15%
1 gen 1966 anni
7.662
-0.078
-1.01%
1 gen 1967 anni
7.526
-0.136
-1.78%
1 gen 1968 anni
7.405
-0.121
-1.61%
1 gen 1969 anni
7.293
-0.112
-1.52%
1 gen 1970 anni
7.174
-0.119
-1.63%
1 gen 1971 anni
7.113
-0.061
-0.85%
1 gen 1972 anni
7.119
+0.006
0.09%
1 gen 1973 anni
7.138
+0.019
0.27%
1 gen 1974 anni
7.17
+0.032
0.45%
1 gen 1975 anni
7.205
+0.035
0.49%
1 gen 1976 anni
7.16
-0.046
-0.63%
1 gen 1977 anni
7.048
-0.111
-1.55%
1 gen 1978 anni
6.952
-0.096
-1.36%
1 gen 1979 anni
6.856
-0.096
-1.39%
1 gen 1980 anni
6.756
-0.1
-1.46%
1 gen 1981 anni
6.647
-0.108
-1.6%
1 gen 1982 anni
6.545
-0.103
-1.54%
1 gen 1983 anni
6.458
-0.086
-1.32%
1 gen 1984 anni
6.378
-0.08
-1.24%
1 gen 1985 anni
6.298
-0.08
-1.26%
1 gen 1986 anni
6.258
-0.039
-0.62%
1 gen 1987 anni
6.259
+0.0
0.01%
1 gen 1988 anni
6.254
-0.005
-0.07%
1 gen 1989 anni
6.249
-0.005
-0.08%
1 gen 1990 anni
6.246
-0.003
-0.04%
1 gen 1991 anni
6.257
+0.011
0.17%
1 gen 1992 anni
6.281
+0.024
0.38%
1 gen 1993 anni
6.307
+0.026
0.42%
1 gen 1994 anni
6.337
+0.03
0.47%
1 gen 1995 anni
6.373
+0.036
0.57%
1 gen 1996 anni
6.39
+0.017
0.26%
1 gen 1997 anni
6.382
-0.008
-0.13%
1 gen 1998 anni
6.37
-0.011
-0.18%
1 gen 1999 anni
6.353
-0.018
-0.28%
1 gen 2000 anni
6.332
-0.021
-0.33%
1 gen 2001 anni
6.308
-0.023
-0.37%
1 gen 2002 anni
6.283
-0.025
-0.4%
1 gen 2003 anni
6.265
-0.018
-0.28%
1 gen 2004 anni
6.258
-0.007
-0.12%
1 gen 2005 anni
6.259
+0.001
0.01%
1 gen 2006 anni
6.275
+0.016
0.26%
1 gen 2007 anni
6.304
+0.029
0.47%
1 gen 2008 anni
6.33
+0.026
0.41%
1 gen 2009 anni
6.345
+0.015
0.24%
1 gen 2010 anni
6.352
+0.007
0.11%
1 gen 2011 anni
6.36
+0.007
0.12%
1 gen 2012 anni
6.37
+0.01
0.16%
1 gen 2013 anni
6.386
+0.016
0.26%
1 gen 2014 anni
6.408
+0.021
0.33%
1 gen 2015 anni
6.425
+0.017
0.27%
1 gen 2016 anni
6.44
+0.015
0.24%
Classificazione dei paesi secondo i statistiche attuali per anni


Commenti: