29
/it/
it
AIzaSyAYiBZKx7MnpbEhh9jyipgxe19OcubqV5w
April 1, 2024
207248
Nepal
NPL
true
2
1
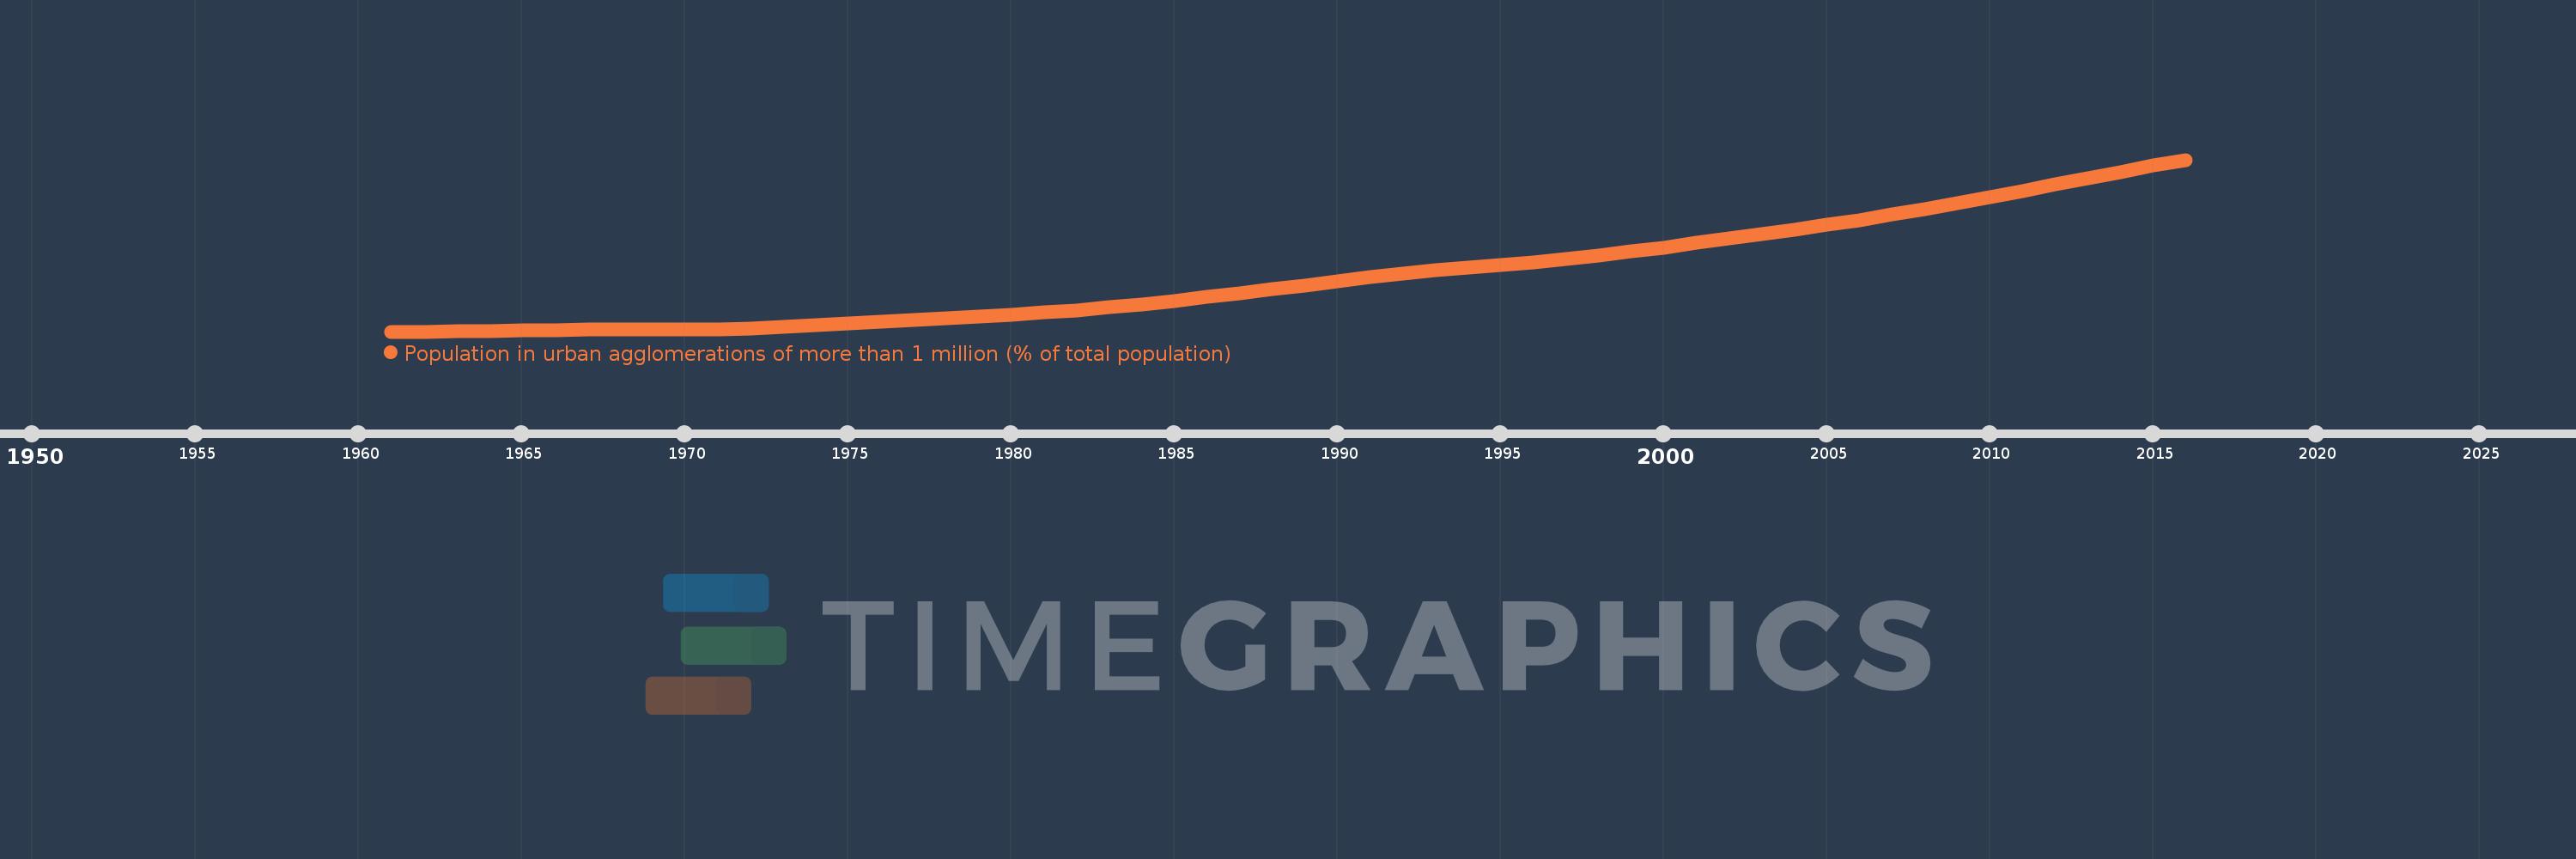
Population in urban agglomerations of more than 1 million (% of total population)
2016,2015,2014,2013,2012,2011,2010,2009,2008,2007,2006,2005,2004,2003,2002,2001,2000,1999,1998,1997,1996,1995,1994,1993,1992,1991,1990,1989,1988,1987,1986,1985,1984,1983,1982,1981,1980,1979,1978,1977,1976,1975,1974,1973,1972,1971,1970,1969,1968,1967,1966,1965,1964,1963,1962,1961
Queste statistiche in altri paesi:
Linea del tempo:
Questa scala temporale mostra un grafico dal 1961 anno al 2016 anno. Nepal. I dati fino ad 1960 anno non disponibili. Il numero di osservazioni attuali secondo i date: 56.
La fonte (nome):
Indicatori dello sviluppo mondiale
La fonte (organizzazione):
United Nations, World Urbanization Prospects.
Categorie:
Climate Change, Urban Development
sono stati aggiornati
23 apr 2017 anni
Indicatori delle variazioni dei valori per anni
Minima:
1.185
1 gen 1961 anni
Massimo:
4.147
1 gen 2016 anni
Alla data di osservazione
Valore
Variazione assoluta
La variazione rispetto al valore precedente
1 gen 1961 anni
1.185
+1.185
0.0%
1 gen 1962 anni
1.185
+0.0
0.03%
1 gen 1963 anni
1.192
+0.007
0.6%
1 gen 1964 anni
1.199
+0.007
0.57%
1 gen 1965 anni
1.206
+0.006
0.53%
1 gen 1966 anni
1.211
+0.006
0.46%
1 gen 1967 anni
1.216
+0.005
0.4%
1 gen 1968 anni
1.22
+0.004
0.33%
1 gen 1969 anni
1.223
+0.003
0.28%
1 gen 1970 anni
1.226
+0.003
0.22%
1 gen 1971 anni
1.228
+0.002
0.18%
1 gen 1972 anni
1.231
+0.002
0.2%
1 gen 1973 anni
1.261
+0.03
2.44%
1 gen 1974 anni
1.291
+0.03
2.39%
1 gen 1975 anni
1.322
+0.03
2.36%
1 gen 1976 anni
1.352
+0.031
2.33%
1 gen 1977 anni
1.384
+0.031
2.31%
1 gen 1978 anni
1.415
+0.031
2.27%
1 gen 1979 anni
1.447
+0.032
2.26%
1 gen 1980 anni
1.479
+0.032
2.23%
1 gen 1981 anni
1.512
+0.033
2.22%
1 gen 1982 anni
1.546
+0.034
2.22%
1 gen 1983 anni
1.601
+0.055
3.56%
1 gen 1984 anni
1.658
+0.057
3.56%
1 gen 1985 anni
1.717
+0.059
3.59%
1 gen 1986 anni
1.779
+0.062
3.6%
1 gen 1987 anni
1.844
+0.065
3.66%
1 gen 1988 anni
1.912
+0.068
3.7%
1 gen 1989 anni
1.983
+0.07
3.68%
1 gen 1990 anni
2.053
+0.071
3.56%
1 gen 1991 anni
2.123
+0.07
3.42%
1 gen 1992 anni
2.192
+0.069
3.24%
1 gen 1993 anni
2.237
+0.044
2.02%
1 gen 1994 anni
2.281
+0.044
1.98%
1 gen 1995 anni
2.328
+0.047
2.07%
1 gen 1996 anni
2.379
+0.051
2.21%
1 gen 1997 anni
2.436
+0.056
2.37%
1 gen 1998 anni
2.497
+0.061
2.5%
1 gen 1999 anni
2.563
+0.066
2.65%
1 gen 2000 anni
2.635
+0.072
2.8%
1 gen 2001 anni
2.712
+0.078
2.94%
1 gen 2002 anni
2.794
+0.081
3.0%
1 gen 2003 anni
2.864
+0.071
2.54%
1 gen 2004 anni
2.941
+0.076
2.66%
1 gen 2005 anni
3.022
+0.082
2.78%
1 gen 2006 anni
3.109
+0.087
2.87%
1 gen 2007 anni
3.201
+0.092
2.97%
1 gen 2008 anni
3.299
+0.098
3.06%
1 gen 2009 anni
3.402
+0.102
3.1%
1 gen 2010 anni
3.506
+0.105
3.08%
1 gen 2011 anni
3.613
+0.106
3.04%
1 gen 2012 anni
3.72
+0.107
2.97%
1 gen 2013 anni
3.829
+0.109
2.92%
1 gen 2014 anni
3.939
+0.11
2.88%
1 gen 2015 anni
4.052
+0.113
2.88%
1 gen 2016 anni
4.147
+0.095
2.35%
Classificazione dei paesi secondo i statistiche attuali per anni


Commenti: