29
/it/
it
AIzaSyAYiBZKx7MnpbEhh9jyipgxe19OcubqV5w
April 1, 2024
139658
Germany
DEU
true
2
1
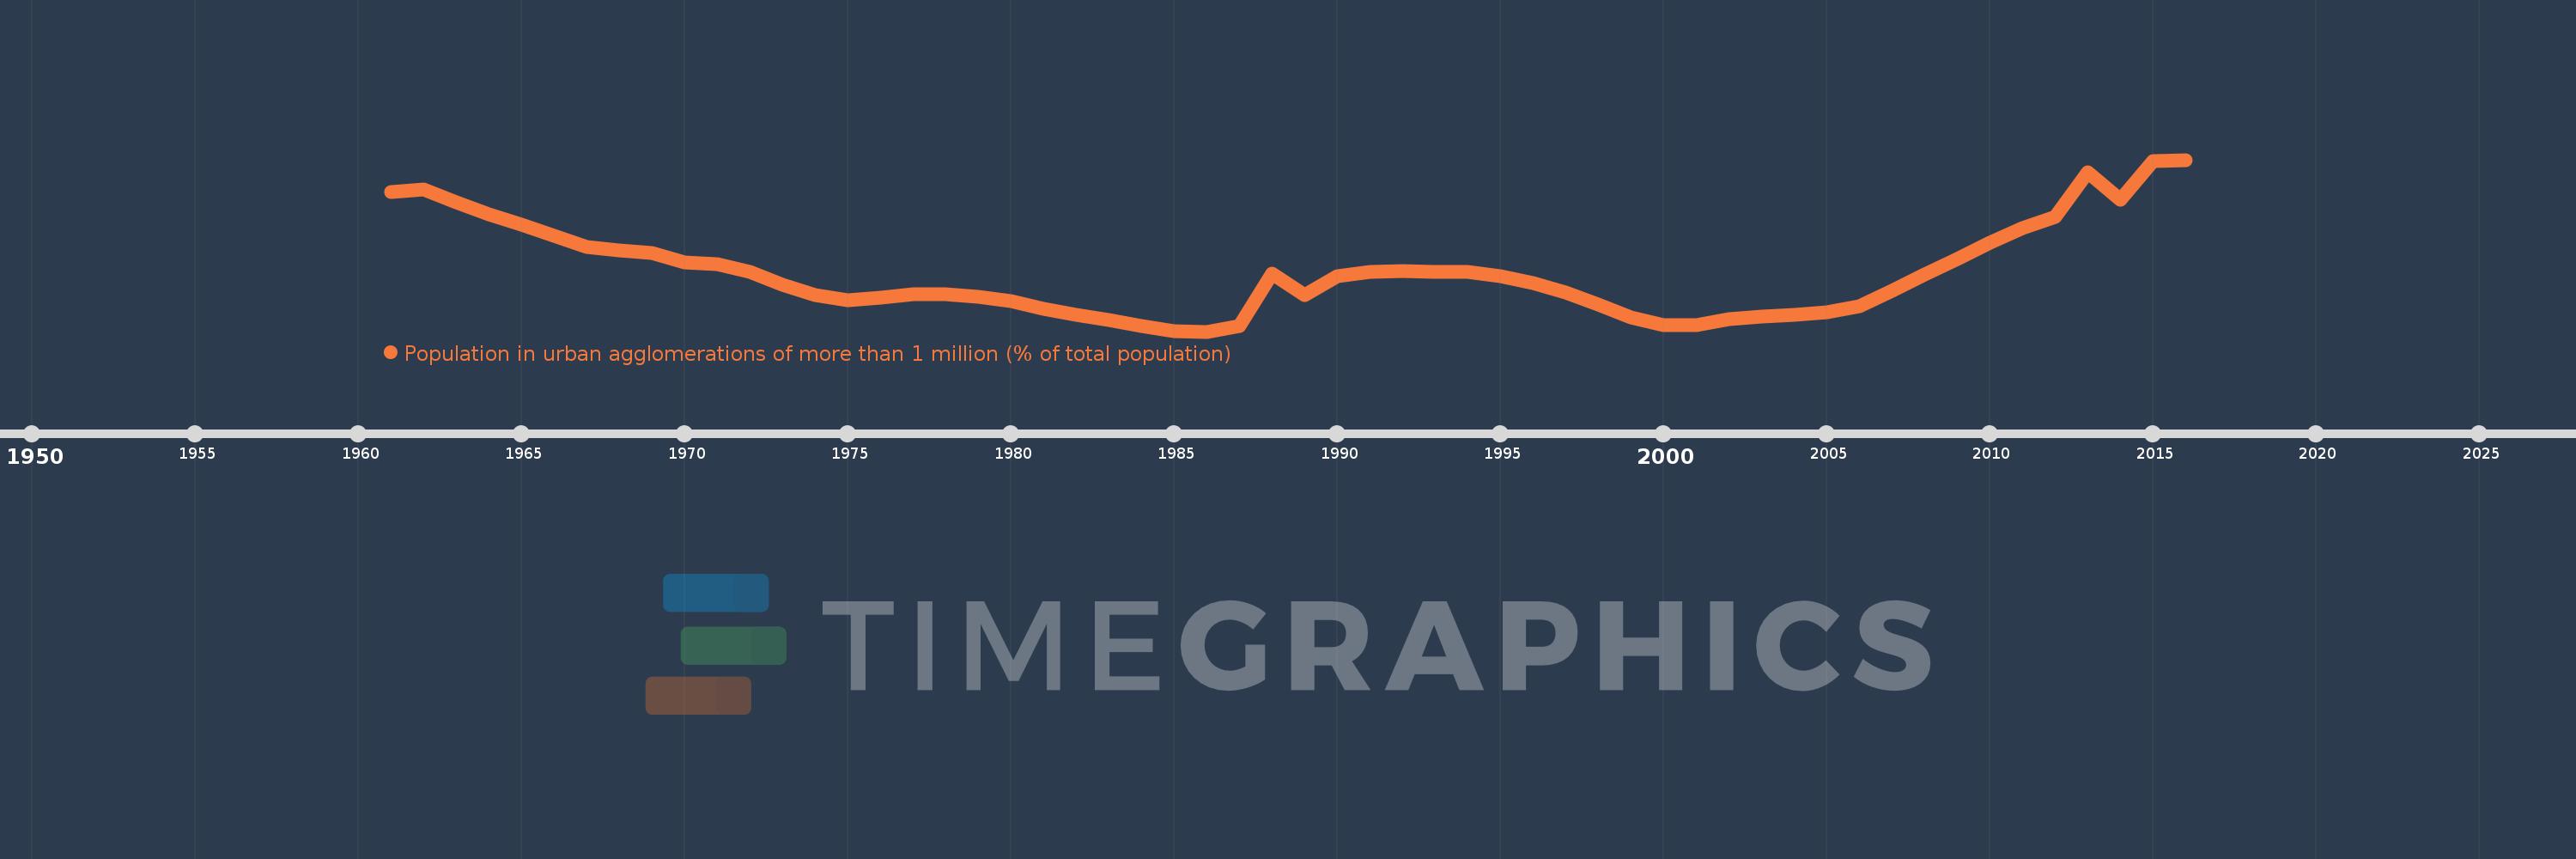
Population in urban agglomerations of more than 1 million (% of total population)
2016,2015,2014,2013,2012,2011,2010,2009,2008,2007,2006,2005,2004,2003,2002,2001,2000,1999,1998,1997,1996,1995,1994,1993,1992,1991,1990,1989,1988,1987,1986,1985,1984,1983,1982,1981,1980,1979,1978,1977,1976,1975,1974,1973,1972,1971,1970,1969,1968,1967,1966,1965,1964,1963,1962,1961
Queste statistiche in altri paesi:
Linea del tempo:
Questa scala temporale mostra un grafico dal 1961 anno al 2016 anno. Germany. I dati fino ad 1960 anno non disponibili. Il numero di osservazioni attuali secondo i date: 56.
La fonte (nome):
Indicatori dello sviluppo mondiale
La fonte (organizzazione):
United Nations, World Urbanization Prospects.
Categorie:
Climate Change, Urban Development
sono stati aggiornati
23 apr 2017 anni
Indicatori delle variazioni dei valori per anni
Minima:
8.796
1 gen 1986 anni
Massimo:
9.665
1 gen 2016 anni
Alla data di osservazione
Valore
Variazione assoluta
La variazione rispetto al valore precedente
1 gen 1961 anni
9.503
+9.503
0.0%
1 gen 1962 anni
9.513
+0.01
0.11%
1 gen 1963 anni
9.452
-0.061
-0.64%
1 gen 1964 anni
9.387
-0.065
-0.68%
1 gen 1965 anni
9.335
-0.052
-0.56%
1 gen 1966 anni
9.279
-0.056
-0.6%
1 gen 1967 anni
9.226
-0.053
-0.57%
1 gen 1968 anni
9.208
-0.018
-0.19%
1 gen 1969 anni
9.193
-0.016
-0.17%
1 gen 1970 anni
9.145
-0.047
-0.51%
1 gen 1971 anni
9.136
-0.009
-0.1%
1 gen 1972 anni
9.097
-0.04
-0.44%
1 gen 1973 anni
9.031
-0.066
-0.73%
1 gen 1974 anni
8.98
-0.05
-0.56%
1 gen 1975 anni
8.955
-0.025
-0.28%
1 gen 1976 anni
8.967
+0.012
0.14%
1 gen 1977 anni
8.985
+0.018
0.2%
1 gen 1978 anni
8.985
0.0
0.0%
1 gen 1979 anni
8.973
-0.012
-0.14%
1 gen 1980 anni
8.949
-0.024
-0.26%
1 gen 1981 anni
8.912
-0.038
-0.42%
1 gen 1982 anni
8.879
-0.032
-0.36%
1 gen 1983 anni
8.853
-0.026
-0.29%
1 gen 1984 anni
8.825
-0.029
-0.32%
1 gen 1985 anni
8.799
-0.026
-0.29%
1 gen 1986 anni
8.796
-0.003
-0.04%
1 gen 1987 anni
8.823
+0.027
0.31%
1 gen 1988 anni
9.091
+0.269
3.05%
1 gen 1989 anni
8.982
-0.109
-1.2%
1 gen 1990 anni
9.075
+0.093
1.04%
1 gen 1991 anni
9.1
+0.025
0.28%
1 gen 1992 anni
9.104
+0.004
0.04%
1 gen 1993 anni
9.099
-0.005
-0.06%
1 gen 1994 anni
9.099
0.0
-0.01%
1 gen 1995 anni
9.076
-0.022
-0.25%
1 gen 1996 anni
9.04
-0.036
-0.4%
1 gen 1997 anni
8.993
-0.046
-0.51%
1 gen 1998 anni
8.934
-0.06
-0.66%
1 gen 1999 anni
8.868
-0.066
-0.74%
1 gen 2000 anni
8.83
-0.038
-0.42%
1 gen 2001 anni
8.83
+0.0
0.0%
1 gen 2002 anni
8.857
+0.027
0.3%
1 gen 2003 anni
8.872
+0.015
0.17%
1 gen 2004 anni
8.882
+0.01
0.11%
1 gen 2005 anni
8.894
+0.012
0.14%
1 gen 2006 anni
8.926
+0.032
0.37%
1 gen 2007 anni
9.002
+0.075
0.84%
1 gen 2008 anni
9.084
+0.083
0.92%
1 gen 2009 anni
9.162
+0.077
0.85%
1 gen 2010 anni
9.245
+0.083
0.91%
1 gen 2011 anni
9.319
+0.075
0.81%
1 gen 2012 anni
9.378
+0.059
0.63%
1 gen 2013 anni
9.6
+0.222
2.37%
1 gen 2014 anni
9.462
-0.138
-1.44%
1 gen 2015 anni
9.66
+0.197
2.09%
1 gen 2016 anni
9.665
+0.005
0.05%
Classificazione dei paesi secondo i statistiche attuali per anni


Commenti: