29
/it/
it
AIzaSyAYiBZKx7MnpbEhh9jyipgxe19OcubqV5w
April 1, 2024
236415
Senegal
SEN
true
2
1
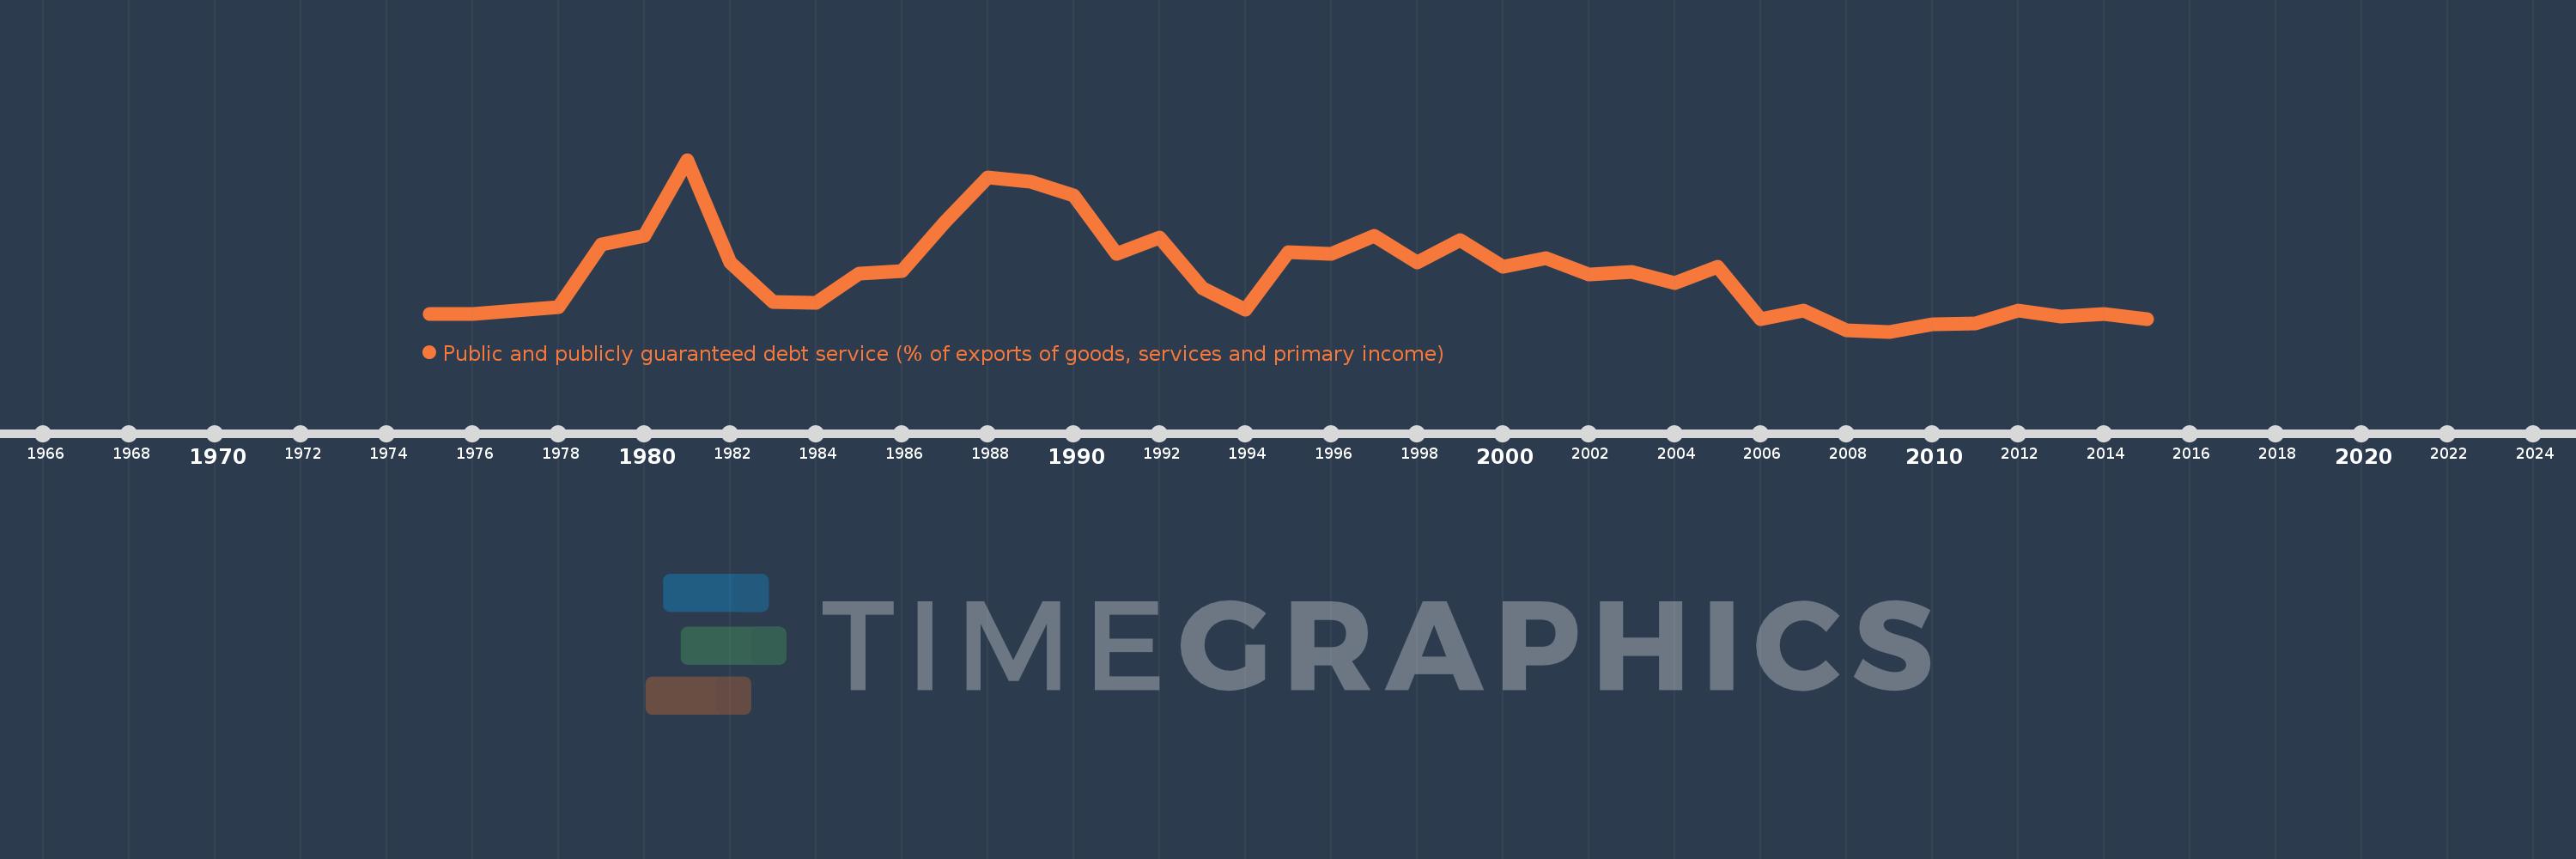
Public and publicly guaranteed debt service (% of exports of goods, services and primary income)
2015,2014,2013,2012,2011,2010,2009,2008,2007,2006,2005,2004,2003,2002,2001,2000,1999,1998,1997,1996,1995,1994,1993,1992,1991,1990,1989,1988,1987,1986,1985,1984,1983,1982,1981,1980,1979,1978,1977,1976,1975
Queste statistiche in altri paesi:
Linea del tempo:
Questa scala temporale mostra un grafico dal 1975 anno al 2015 anno. Senegal. I dati fino ad 1974 anno non disponibili. Il numero di osservazioni attuali secondo i date: 41.
La fonte (nome):
Indicatori dello sviluppo mondiale
La fonte (organizzazione):
World Bank.
Categorie:
External Debt
sono stati aggiornati
23 apr 2017 anni
Indicatori delle variazioni dei valori per anni
Minima:
3.26
1 gen 2009 anni
Massimo:
26.33
1 gen 1981 anni
Alla data di osservazione
Valore
Variazione assoluta
La variazione rispetto al valore precedente
1 gen 1975 anni
5.577
+5.577
0.0%
1 gen 1976 anni
5.678
+0.101
1.81%
1 gen 1977 anni
6.084
+0.406
7.15%
1 gen 1978 anni
6.592
+0.508
8.35%
1 gen 1979 anni
14.931
+8.339
126.5%
1 gen 1980 anni
16.156
+1.225
8.21%
1 gen 1981 anni
26.33
+10.174
62.97%
1 gen 1982 anni
12.523
-13.806
-52.44%
1 gen 1983 anni
7.206
-5.317
-42.46%
1 gen 1984 anni
7.094
-0.113
-1.56%
1 gen 1985 anni
11.022
+3.929
55.38%
1 gen 1986 anni
11.422
+0.399
3.62%
1 gen 1987 anni
17.917
+6.496
56.87%
1 gen 1988 anni
23.98
+6.063
33.84%
1 gen 1989 anni
23.384
-0.596
-2.48%
1 gen 1990 anni
21.525
-1.859
-7.95%
1 gen 1991 anni
13.723
-7.802
-36.25%
1 gen 1992 anni
15.879
+2.156
15.71%
1 gen 1993 anni
9.073
-6.805
-42.86%
1 gen 1994 anni
6.254
-2.819
-31.07%
1 gen 1995 anni
13.899
+7.645
122.24%
1 gen 1996 anni
13.74
-0.159
-1.15%
1 gen 1997 anni
16.072
+2.332
16.97%
1 gen 1998 anni
12.569
-3.503
-21.79%
1 gen 1999 anni
15.554
+2.985
23.75%
1 gen 2000 anni
11.923
-3.631
-23.34%
1 gen 2001 anni
13.103
+1.18
9.89%
1 gen 2002 anni
10.936
-2.167
-16.54%
1 gen 2003 anni
11.238
+0.302
2.76%
1 gen 2004 anni
9.794
-1.444
-12.85%
1 gen 2005 anni
11.929
+2.135
21.8%
1 gen 2006 anni
4.987
-6.942
-58.19%
1 gen 2007 anni
6.127
+1.14
22.86%
1 gen 2008 anni
3.46
-2.668
-43.54%
1 gen 2009 anni
3.26
-0.2
-5.77%
1 gen 2010 anni
4.199
+0.939
28.79%
1 gen 2011 anni
4.334
+0.135
3.22%
1 gen 2012 anni
6.089
+1.755
40.49%
1 gen 2013 anni
5.305
-0.784
-12.88%
1 gen 2014 anni
5.648
+0.344
6.48%
1 gen 2015 anni
4.911
-0.737
-13.05%
Classificazione dei paesi secondo i statistiche attuali per anni


Commenti: