29
/it/
it
AIzaSyAYiBZKx7MnpbEhh9jyipgxe19OcubqV5w
April 1, 2024
29452
East Asia & Pacific (IDA & IBRD countries)
TEA
false
2
1
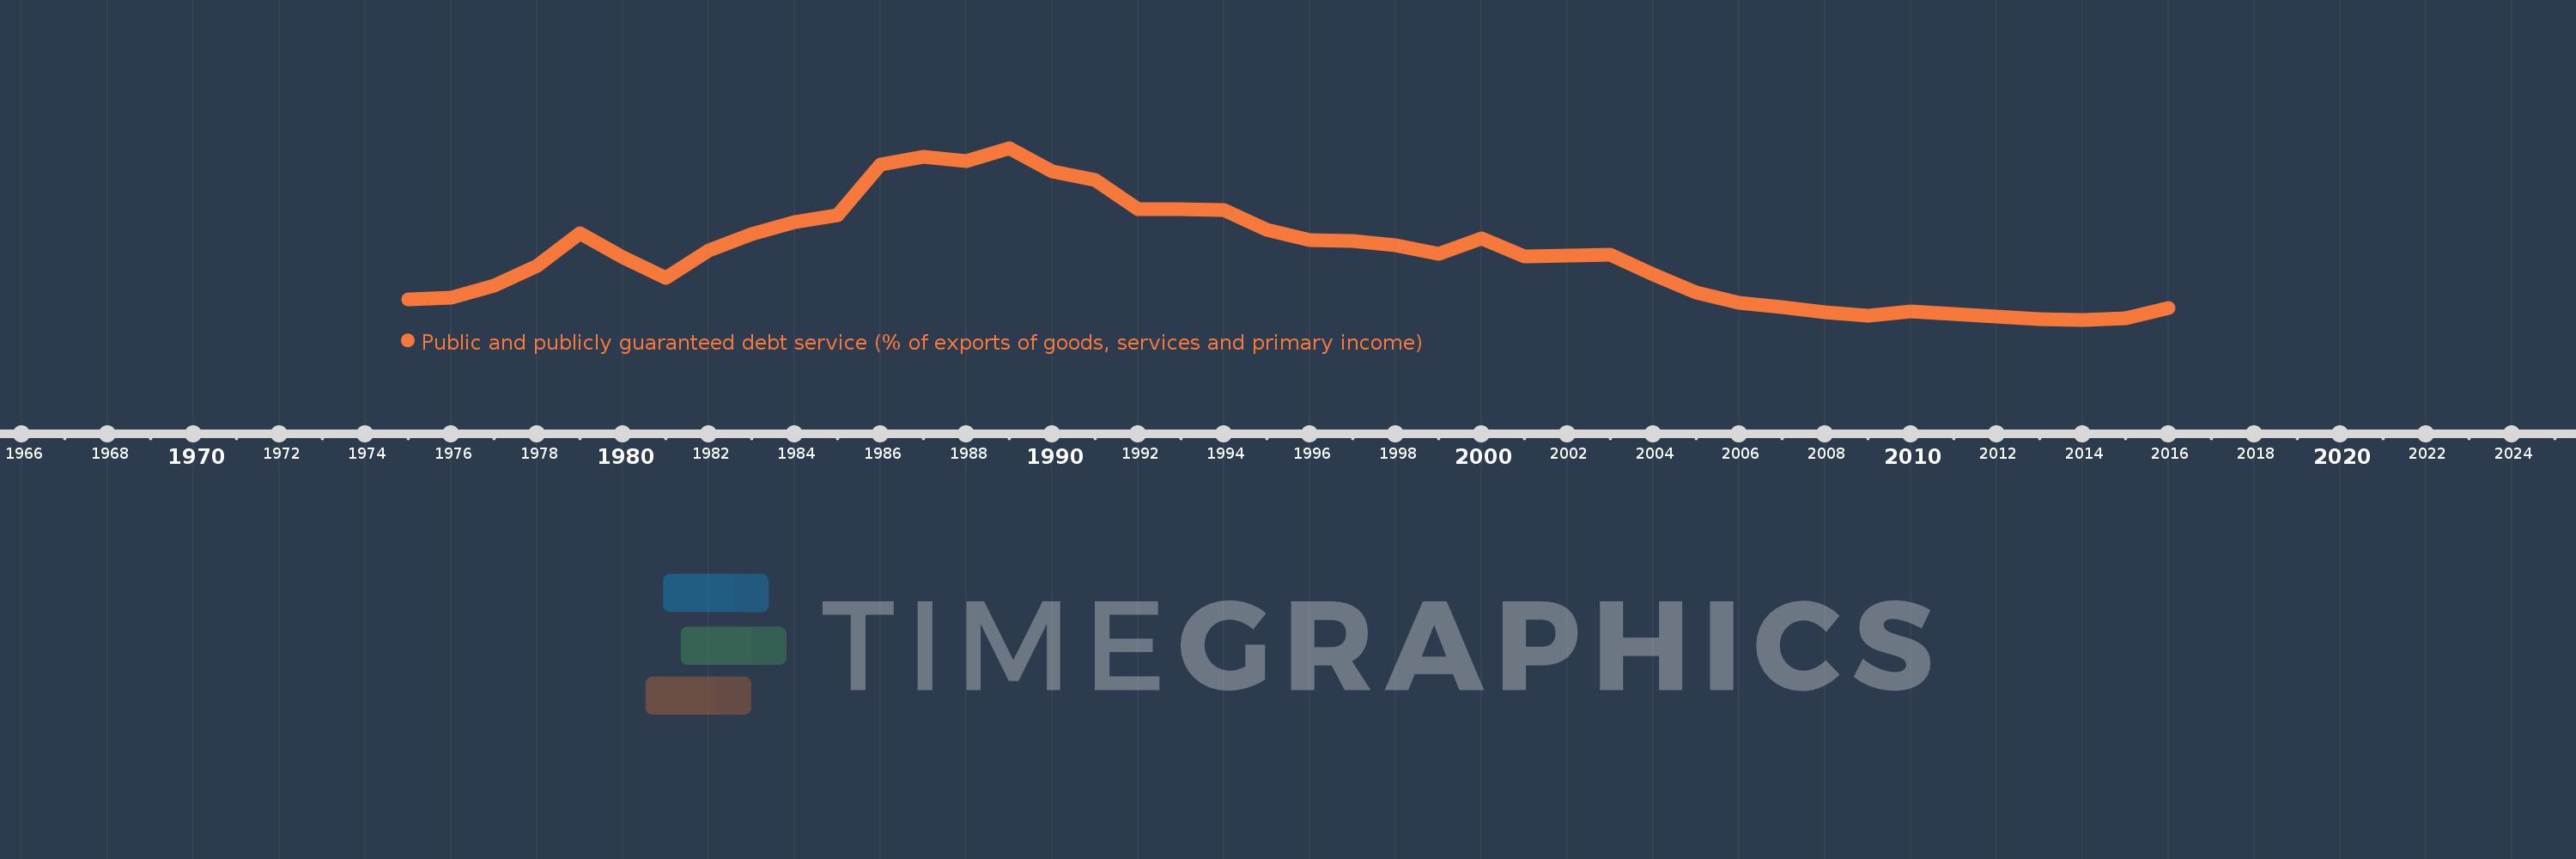
Public and publicly guaranteed debt service (% of exports of goods, services and primary income)
2016,2015,2014,2013,2012,2011,2010,2009,2008,2007,2006,2005,2004,2003,2002,2001,2000,1999,1998,1997,1996,1995,1994,1993,1992,1991,1990,1989,1988,1987,1986,1985,1984,1983,1982,1981,1980,1979,1978,1977,1976,1975
Queste statistiche in altri paesi:
Linea del tempo:
Questa scala temporale mostra un grafico dal 1975 anno al 2016 anno. East Asia & Pacific (IDA & IBRD countries). I dati fino ad 1974 anno non disponibili. Il numero di osservazioni attuali secondo i date: 42.
La fonte (nome):
Indicatori dello sviluppo mondiale
La fonte (organizzazione):
World Bank.
Categorie:
External Debt
sono stati aggiornati
23 apr 2017 anni
Indicatori delle variazioni dei valori per anni
Minima:
0.986
1 gen 2014 anni
Massimo:
16.564
1 gen 1989 anni
Alla data di osservazione
Valore
Variazione assoluta
La variazione rispetto al valore precedente
1 gen 1975 anni
2.853
+2.853
0.0%
1 gen 1976 anni
2.984
+0.131
4.58%
1 gen 1977 anni
4.043
+1.059
35.49%
1 gen 1978 anni
5.832
+1.79
44.26%
1 gen 1979 anni
8.862
+3.029
51.94%
1 gen 1980 anni
6.613
-2.249
-25.38%
1 gen 1981 anni
4.793
-1.82
-27.52%
1 gen 1982 anni
7.26
+2.467
51.48%
1 gen 1983 anni
8.737
+1.477
20.35%
1 gen 1984 anni
9.83
+1.093
12.51%
1 gen 1985 anni
10.441
+0.611
6.21%
1 gen 1986 anni
15.095
+4.654
44.58%
1 gen 1987 anni
15.795
+0.7
4.64%
1 gen 1988 anni
15.375
-0.42
-2.66%
1 gen 1989 anni
16.564
+1.189
7.73%
1 gen 1990 anni
14.474
-2.09
-12.62%
1 gen 1991 anni
13.662
-0.812
-5.61%
1 gen 1992 anni
11.036
-2.626
-19.22%
1 gen 1993 anni
11.029
-0.006
-0.06%
1 gen 1994 anni
10.898
-0.132
-1.2%
1 gen 1995 anni
9.12
-1.777
-16.31%
1 gen 1996 anni
8.204
-0.917
-10.05%
1 gen 1997 anni
8.147
-0.057
-0.69%
1 gen 1998 anni
7.778
-0.369
-4.53%
1 gen 1999 anni
6.956
-0.822
-10.57%
1 gen 2000 anni
8.37
+1.414
20.33%
1 gen 2001 anni
6.702
-1.668
-19.93%
1 gen 2002 anni
6.838
+0.137
2.04%
1 gen 2003 anni
6.851
+0.013
0.19%
1 gen 2004 anni
5.069
-1.782
-26.01%
1 gen 2005 anni
3.458
-1.611
-31.78%
1 gen 2006 anni
2.539
-0.919
-26.57%
1 gen 2007 anni
2.121
-0.418
-16.46%
1 gen 2008 anni
1.643
-0.478
-22.55%
1 gen 2009 anni
1.363
-0.28
-17.05%
1 gen 2010 anni
1.743
+0.38
27.88%
1 gen 2011 anni
1.502
-0.241
-13.83%
1 gen 2012 anni
1.282
-0.219
-14.6%
1 gen 2013 anni
1.05
-0.232
-18.09%
1 gen 2014 anni
0.986
-0.064
-6.11%
1 gen 2015 anni
1.084
+0.098
9.9%
1 gen 2016 anni
2.037
+0.953
87.94%
Classificazione dei paesi secondo i statistiche attuali per anni


Commenti: