29
/it/
it
AIzaSyAYiBZKx7MnpbEhh9jyipgxe19OcubqV5w
April 1, 2024
54388
Pacific island small states
PSS
false
2
1
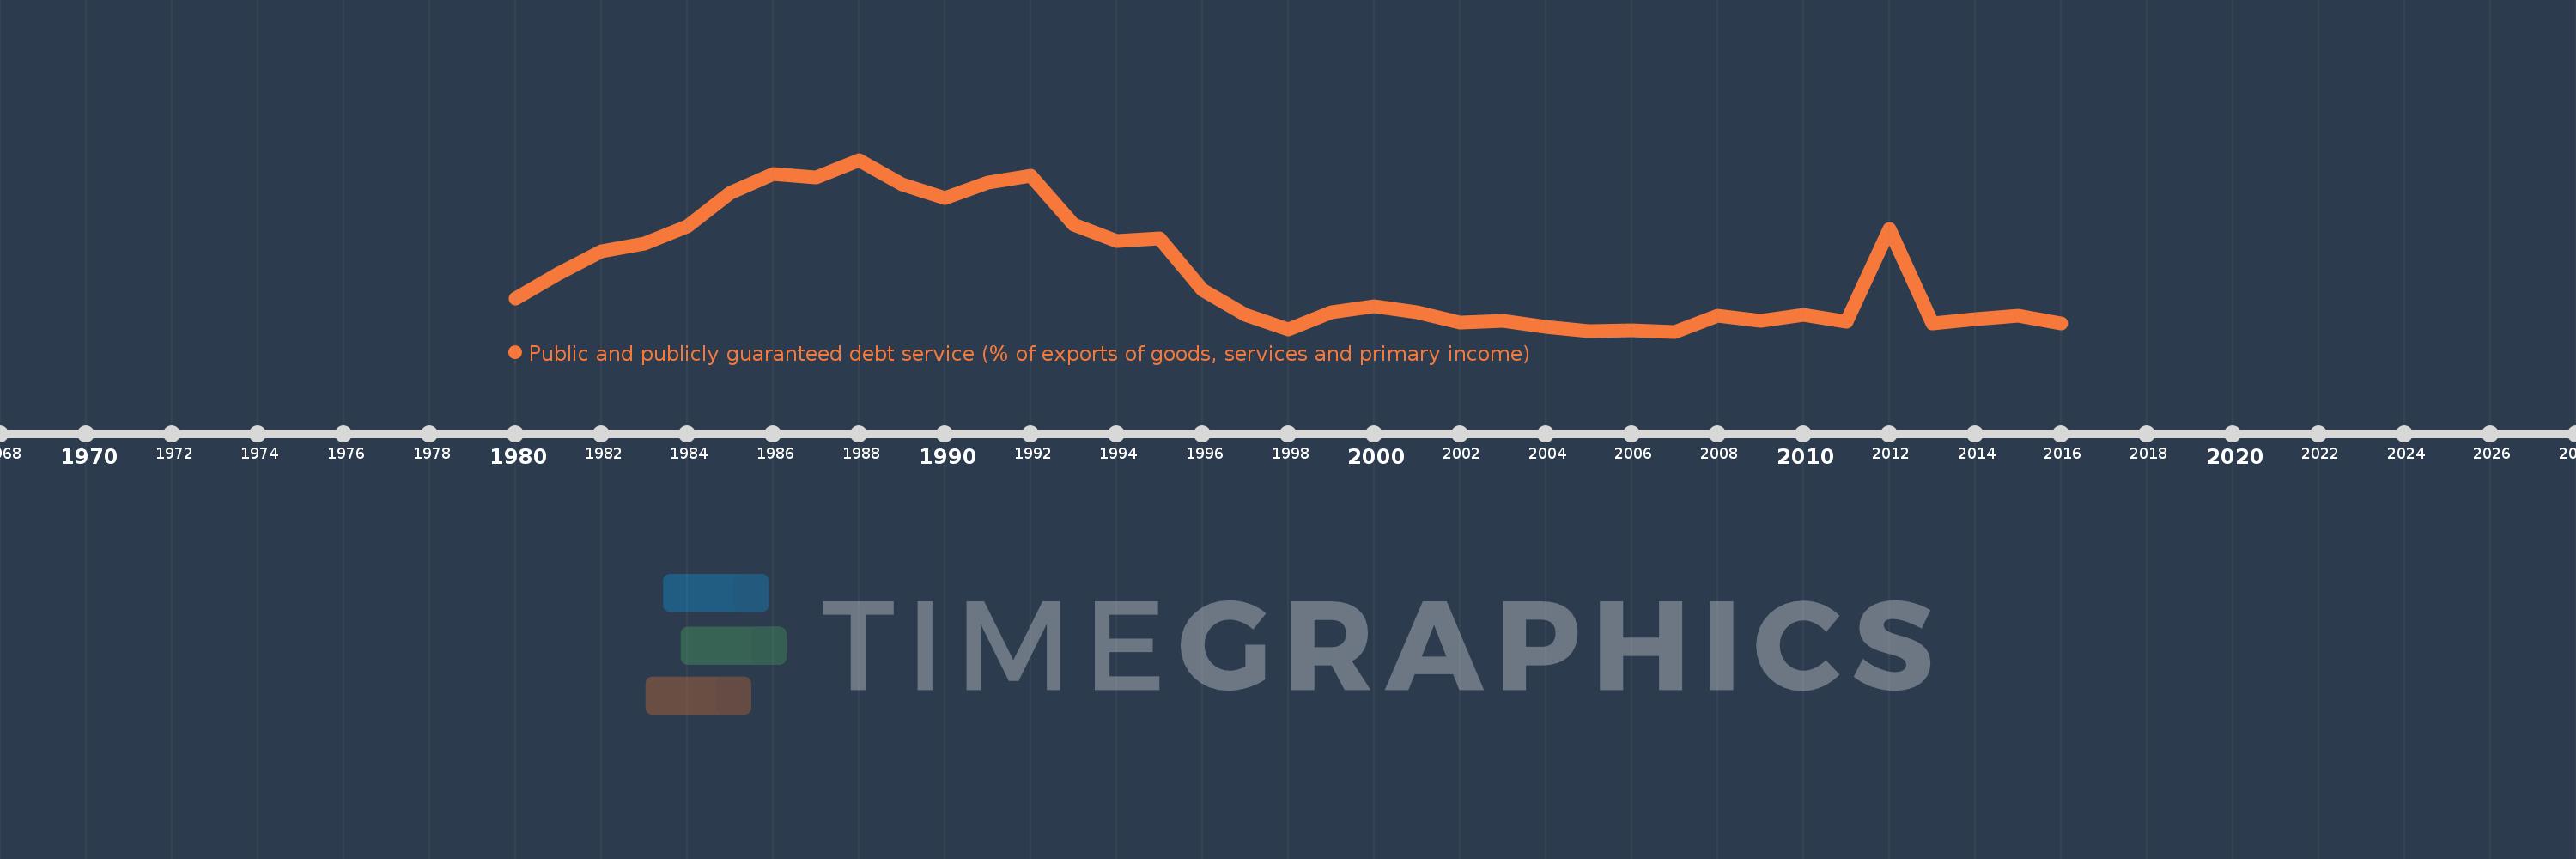
Public and publicly guaranteed debt service (% of exports of goods, services and primary income)
2016,2015,2014,2013,2012,2011,2010,2009,2008,2007,2006,2005,2004,2003,2002,2001,2000,1999,1998,1997,1996,1995,1994,1993,1992,1991,1990,1989,1988,1987,1986,1985,1984,1983,1982,1981,1980
Queste statistiche in altri paesi:
Linea del tempo:
Questa scala temporale mostra un grafico dal 1980 anno al 2016 anno. Pacific island small states. I dati fino ad 1979 anno non disponibili. Il numero di osservazioni attuali secondo i date: 37.
La fonte (nome):
Indicatori dello sviluppo mondiale
La fonte (organizzazione):
World Bank.
Categorie:
External Debt
sono stati aggiornati
23 apr 2017 anni
Indicatori delle variazioni dei valori per anni
Minima:
1.432
1 gen 2007 anni
Massimo:
9.182
1 gen 1988 anni
Alla data di osservazione
Valore
Variazione assoluta
La variazione rispetto al valore precedente
1 gen 1980 anni
2.914
+2.914
0.0%
1 gen 1981 anni
4.056
+1.142
39.2%
1 gen 1982 anni
5.054
+0.998
24.61%
1 gen 1983 anni
5.41
+0.356
7.04%
1 gen 1984 anni
6.175
+0.765
14.14%
1 gen 1985 anni
7.709
+1.534
24.84%
1 gen 1986 anni
8.531
+0.822
10.66%
1 gen 1987 anni
8.371
-0.16
-1.88%
1 gen 1988 anni
9.182
+0.811
9.69%
1 gen 1989 anni
8.082
-1.1
-11.98%
1 gen 1990 anni
7.45
-0.632
-7.81%
1 gen 1991 anni
8.168
+0.718
9.64%
1 gen 1992 anni
8.446
+0.278
3.4%
1 gen 1993 anni
6.241
-2.205
-26.11%
1 gen 1994 anni
5.529
-0.713
-11.42%
1 gen 1995 anni
5.648
+0.12
2.17%
1 gen 1996 anni
3.311
-2.338
-41.39%
1 gen 1997 anni
2.203
-1.107
-33.44%
1 gen 1998 anni
1.53
-0.674
-30.58%
1 gen 1999 anni
2.307
+0.777
50.8%
1 gen 2000 anni
2.561
+0.254
11.01%
1 gen 2001 anni
2.303
-0.258
-10.07%
1 gen 2002 anni
1.842
-0.461
-20.01%
1 gen 2003 anni
1.903
+0.061
3.32%
1 gen 2004 anni
1.646
-0.257
-13.49%
1 gen 2005 anni
1.442
-0.205
-12.43%
1 gen 2006 anni
1.502
+0.06
4.19%
1 gen 2007 anni
1.432
-0.07
-4.65%
1 gen 2008 anni
2.148
+0.716
49.96%
1 gen 2009 anni
1.898
-0.25
-11.62%
1 gen 2010 anni
2.2
+0.302
15.9%
1 gen 2011 anni
1.868
-0.333
-15.12%
1 gen 2012 anni
6.069
+4.202
224.99%
1 gen 2013 anni
1.81
-4.259
-70.17%
1 gen 2014 anni
1.998
+0.188
10.39%
1 gen 2015 anni
2.144
+0.146
7.3%
1 gen 2016 anni
1.811
-0.333
-15.54%
Classificazione dei paesi secondo i statistiche attuali per anni


Commenti: