29
/it/
it
AIzaSyAYiBZKx7MnpbEhh9jyipgxe19OcubqV5w
April 1, 2024
232739
Samoa
WSM
true
2
1
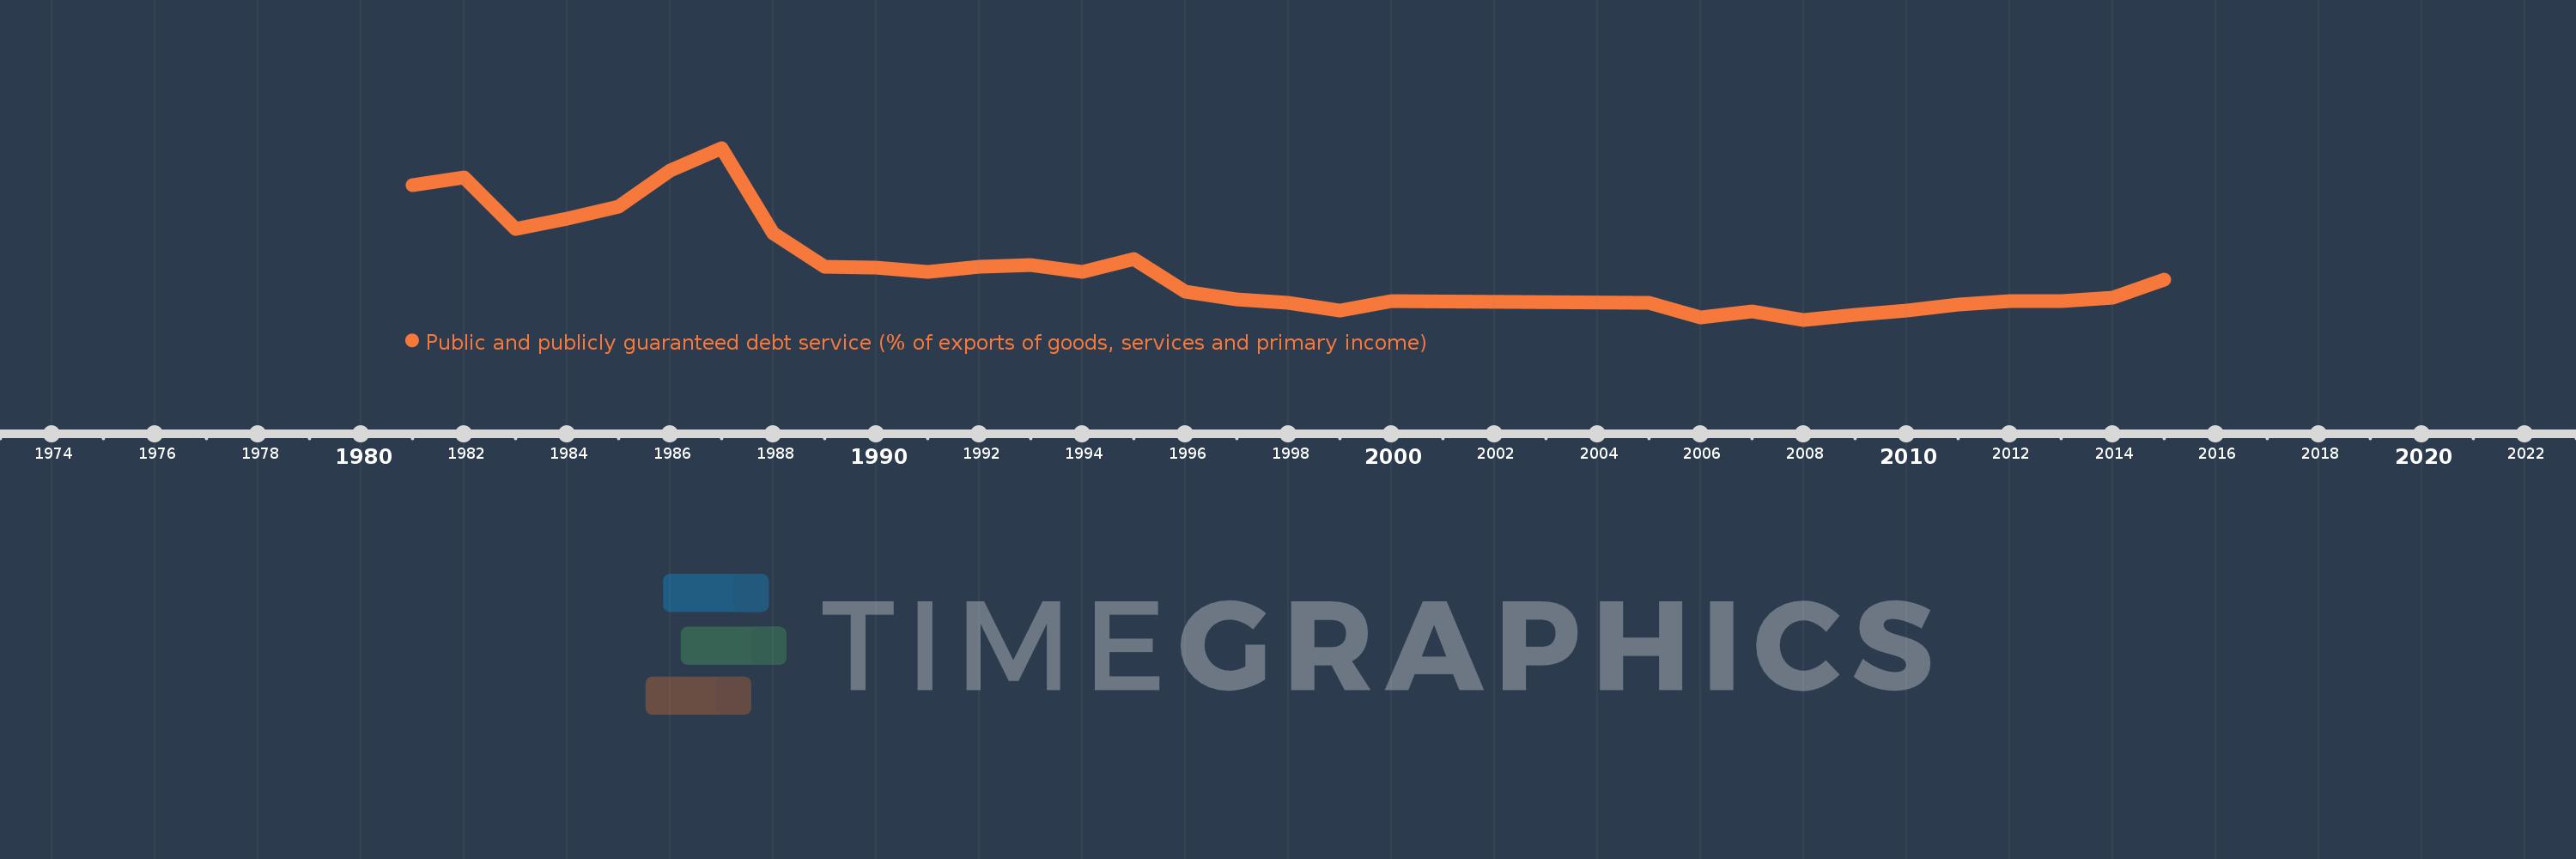
Public and publicly guaranteed debt service (% of exports of goods, services and primary income)
2015,2014,2013,2012,2011,2010,2009,2008,2007,2006,2005,2000,1999,1998,1997,1996,1995,1994,1993,1992,1991,1990,1989,1988,1987,1986,1985,1984,1983,1982,1981
Queste statistiche in altri paesi:
Linea del tempo:
Questa scala temporale mostra un grafico dal 1981 anno al 2015 anno. Samoa. I dati fino ad 1980 anno non disponibili. Il numero di osservazioni attuali secondo i date: 31.
La fonte (nome):
Indicatori dello sviluppo mondiale
La fonte (organizzazione):
World Bank.
Categorie:
External Debt
sono stati aggiornati
23 apr 2017 anni
Indicatori delle variazioni dei valori per anni
Minima:
3.667
1 gen 2008 anni
Massimo:
21.704
1 gen 1987 anni
Alla data di osservazione
Valore
Variazione assoluta
La variazione rispetto al valore precedente
1 gen 1981 anni
17.782
+17.782
0.0%
1 gen 1982 anni
18.598
+0.816
4.59%
1 gen 1983 anni
13.18
-5.419
-29.14%
1 gen 1984 anni
14.249
+1.069
8.11%
1 gen 1985 anni
15.577
+1.328
9.32%
1 gen 1986 anni
19.328
+3.751
24.08%
1 gen 1987 anni
21.704
+2.376
12.3%
1 gen 1988 anni
12.759
-8.945
-41.21%
1 gen 1989 anni
9.269
-3.49
-27.35%
1 gen 1990 anni
9.138
-0.131
-1.41%
1 gen 1991 anni
8.683
-0.455
-4.98%
1 gen 1992 anni
9.269
+0.586
6.74%
1 gen 1993 anni
9.367
+0.098
1.06%
1 gen 1994 anni
8.724
-0.643
-6.87%
1 gen 1995 anni
10.074
+1.35
15.47%
1 gen 1996 anni
6.574
-3.5
-34.74%
1 gen 1997 anni
5.764
-0.81
-12.33%
1 gen 1998 anni
5.437
-0.327
-5.67%
1 gen 1999 anni
4.644
-0.793
-14.58%
1 gen 2000 anni
5.668
+1.023
22.03%
1 gen 2005 anni
5.468
-0.2
-3.53%
1 gen 2006 anni
3.916
-1.551
-28.37%
1 gen 2007 anni
4.513
+0.597
15.23%
1 gen 2008 anni
3.667
-0.846
-18.74%
1 gen 2009 anni
4.16
+0.492
13.43%
1 gen 2010 anni
4.671
+0.512
12.3%
1 gen 2011 anni
5.238
+0.566
12.12%
1 gen 2012 anni
5.608
+0.371
7.08%
1 gen 2013 anni
5.603
-0.006
-0.1%
1 gen 2014 anni
5.973
+0.37
6.61%
1 gen 2015 anni
7.871
+1.898
31.77%
Classificazione dei paesi secondo i statistiche attuali per anni


Commenti: