29
/it/
it
AIzaSyAYiBZKx7MnpbEhh9jyipgxe19OcubqV5w
April 1, 2024
249385
Sri Lanka
LKA
true
2
1
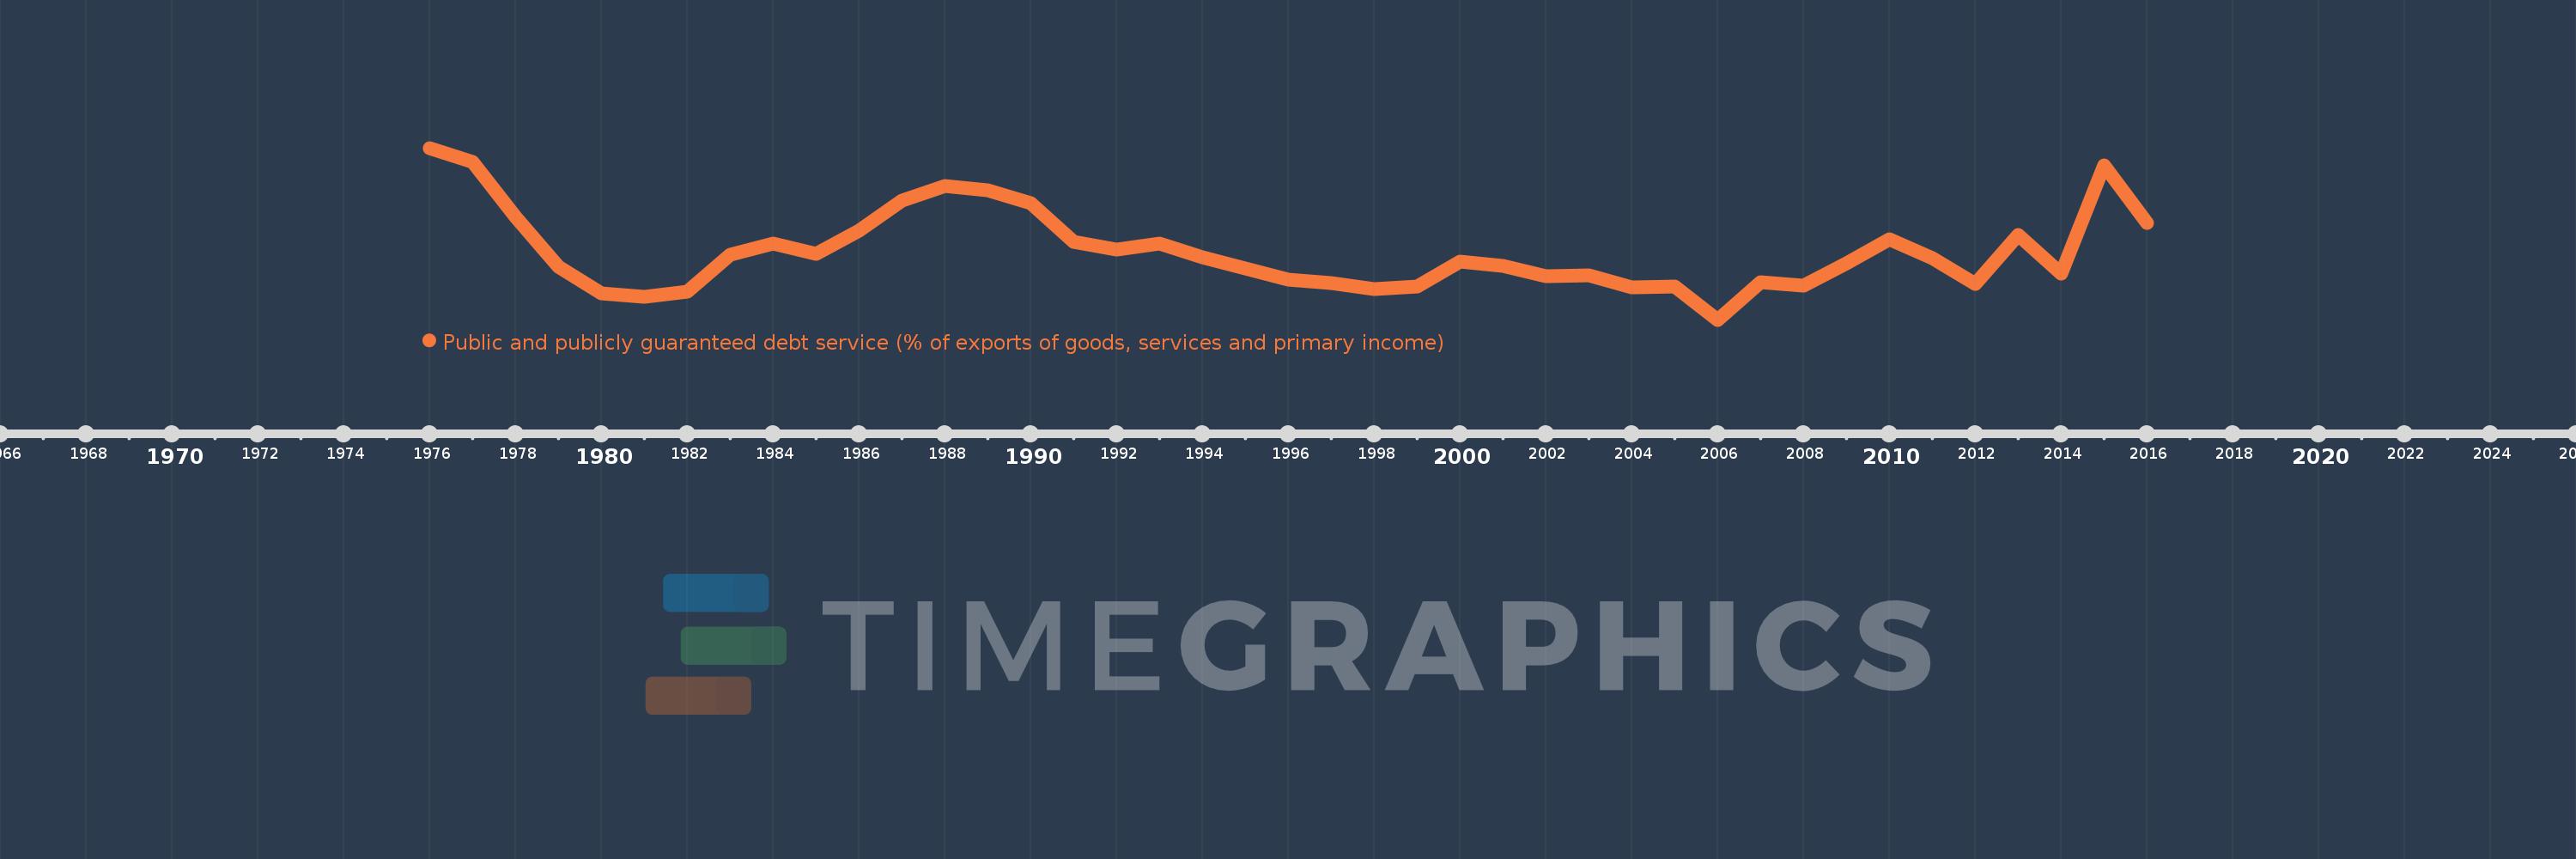
Public and publicly guaranteed debt service (% of exports of goods, services and primary income)
2016,2015,2014,2013,2012,2011,2010,2009,2008,2007,2006,2005,2004,2003,2002,2001,2000,1999,1998,1997,1996,1995,1994,1993,1992,1991,1990,1989,1988,1987,1986,1985,1984,1983,1982,1981,1980,1979,1978,1977,1976
Queste statistiche in altri paesi:
Linea del tempo:
Questa scala temporale mostra un grafico dal 1976 anno al 2016 anno. Sri Lanka. I dati fino ad 1975 anno non disponibili. Il numero di osservazioni attuali secondo i date: 41.
La fonte (nome):
Indicatori dello sviluppo mondiale
La fonte (organizzazione):
World Bank.
Categorie:
External Debt
sono stati aggiornati
23 apr 2017 anni
Indicatori delle variazioni dei valori per anni
Minima:
3.909
1 gen 2006 anni
Massimo:
21.668
1 gen 1976 anni
Alla data di osservazione
Valore
Variazione assoluta
La variazione rispetto al valore precedente
1 gen 1976 anni
21.668
+21.668
0.0%
1 gen 1977 anni
20.258
-1.409
-6.5%
1 gen 1978 anni
14.555
-5.704
-28.16%
1 gen 1979 anni
9.404
-5.151
-35.39%
1 gen 1980 anni
6.655
-2.749
-29.23%
1 gen 1981 anni
6.304
-0.351
-5.27%
1 gen 1982 anni
6.827
+0.523
8.29%
1 gen 1983 anni
10.605
+3.778
55.33%
1 gen 1984 anni
11.782
+1.178
11.11%
1 gen 1985 anni
10.731
-1.052
-8.93%
1 gen 1986 anni
13.075
+2.345
21.85%
1 gen 1987 anni
16.235
+3.159
24.16%
1 gen 1988 anni
17.765
+1.531
9.43%
1 gen 1989 anni
17.297
-0.469
-2.64%
1 gen 1990 anni
15.974
-1.323
-7.65%
1 gen 1991 anni
11.941
-4.033
-25.24%
1 gen 1992 anni
11.151
-0.79
-6.62%
1 gen 1993 anni
11.752
+0.601
5.39%
1 gen 1994 anni
10.365
-1.387
-11.8%
1 gen 1995 anni
9.244
-1.121
-10.82%
1 gen 1996 anni
8.012
-1.232
-13.32%
1 gen 1997 anni
7.713
-0.299
-3.74%
1 gen 1998 anni
7.102
-0.611
-7.93%
1 gen 1999 anni
7.368
+0.266
3.74%
1 gen 2000 anni
9.892
+2.525
34.27%
1 gen 2001 anni
9.462
-0.431
-4.35%
1 gen 2002 anni
8.406
-1.056
-11.16%
1 gen 2003 anni
8.471
+0.065
0.78%
1 gen 2004 anni
7.218
-1.253
-14.79%
1 gen 2005 anni
7.311
+0.093
1.29%
1 gen 2006 anni
3.909
-3.402
-46.54%
1 gen 2007 anni
7.809
+3.9
99.78%
1 gen 2008 anni
7.393
-0.416
-5.33%
1 gen 2009 anni
9.739
+2.346
31.74%
1 gen 2010 anni
12.187
+2.448
25.13%
1 gen 2011 anni
10.312
-1.875
-15.39%
1 gen 2012 anni
7.577
-2.734
-26.52%
1 gen 2013 anni
12.71
+5.132
67.73%
1 gen 2014 anni
8.705
-4.005
-31.51%
1 gen 2015 anni
19.854
+11.149
128.08%
1 gen 2016 anni
13.93
-5.924
-29.84%
Classificazione dei paesi secondo i statistiche attuali per anni


Commenti: