29
/es/
es
AIzaSyAYiBZKx7MnpbEhh9jyipgxe19OcubqV5w
April 1, 2024
236415
Senegal
SEN
true
2
1
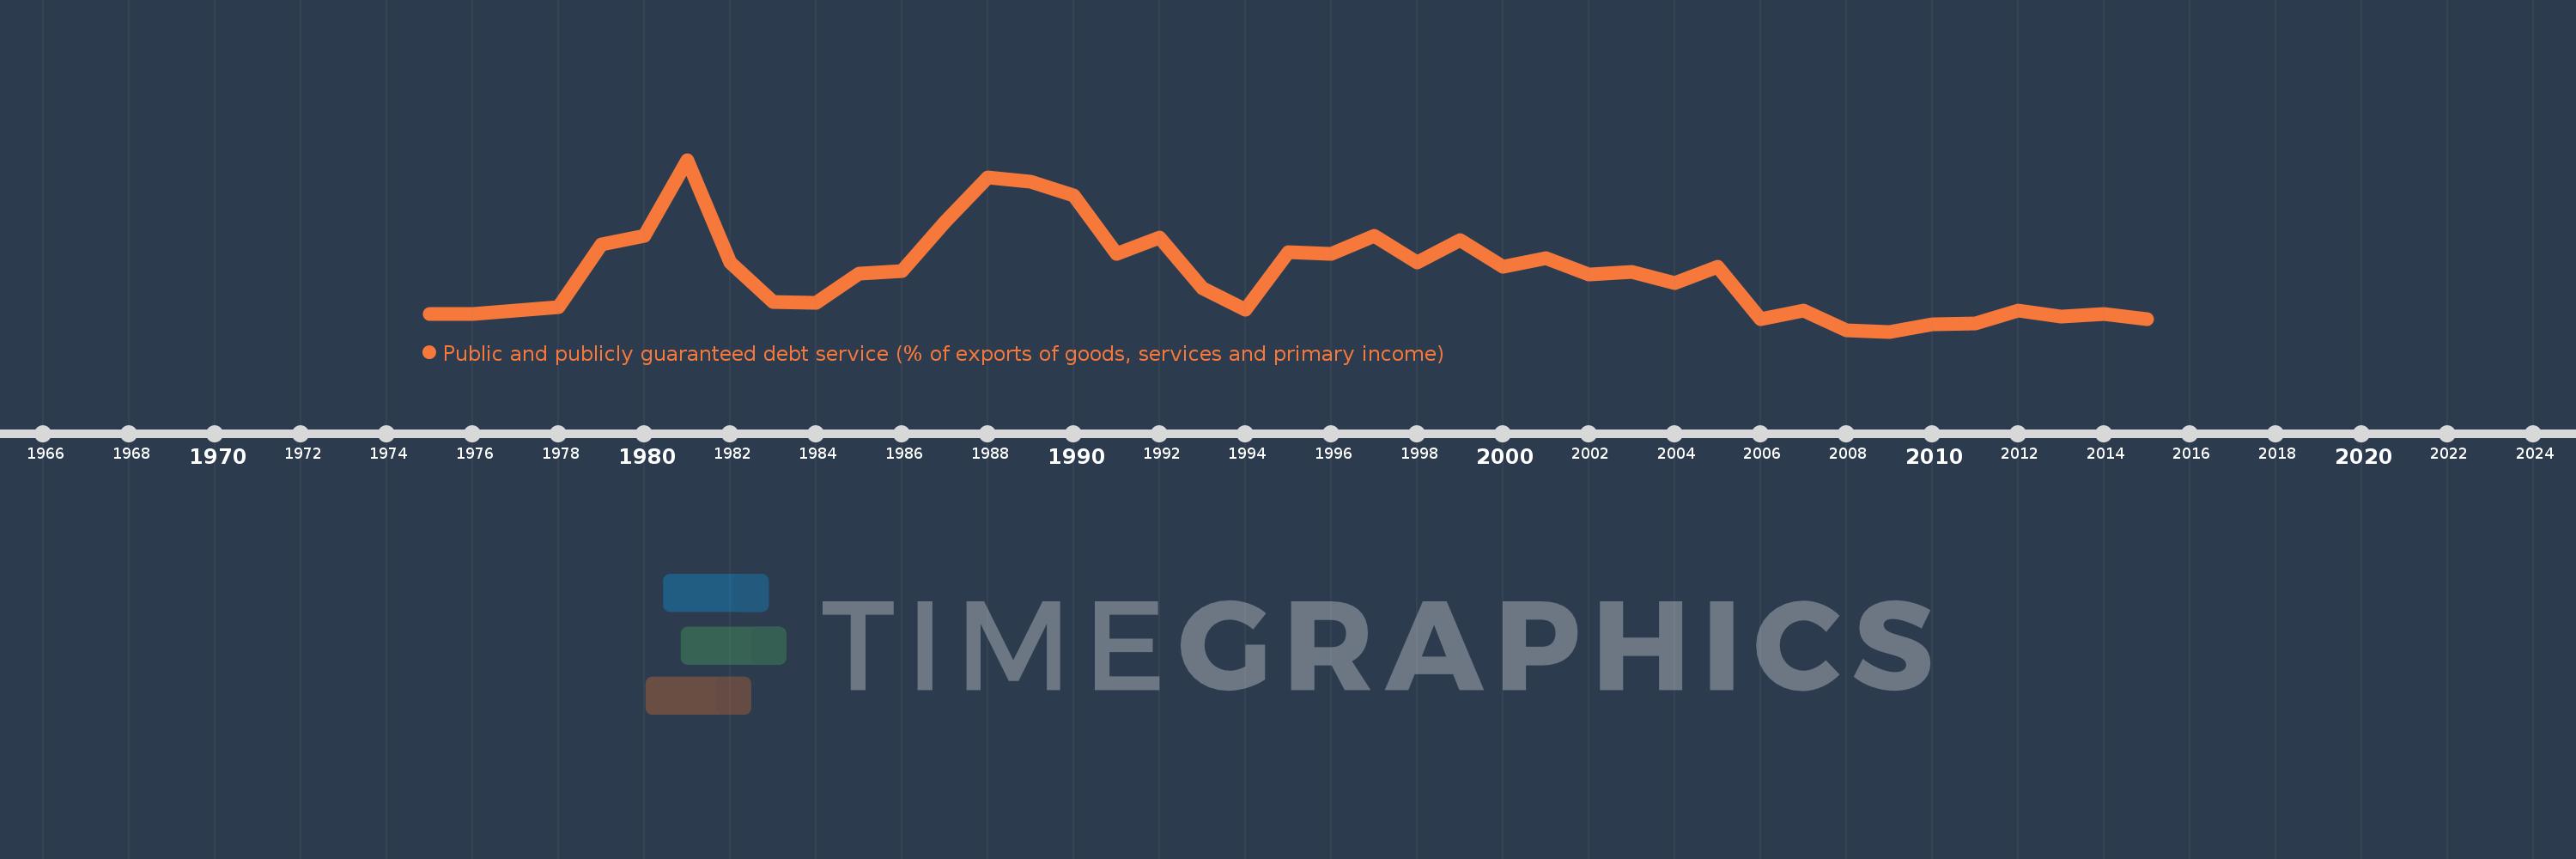
Public and publicly guaranteed debt service (% of exports of goods, services and primary income)
2015,2014,2013,2012,2011,2010,2009,2008,2007,2006,2005,2004,2003,2002,2001,2000,1999,1998,1997,1996,1995,1994,1993,1992,1991,1990,1989,1988,1987,1986,1985,1984,1983,1982,1981,1980,1979,1978,1977,1976,1975
Estas estadísticas en otros países:
línea de tiempo (timeline):
En esta escala de tiempo se presenta un gráfico de 1975 y 2015 de Senegal. Los datos de 1974 están ausentes. El número de observaciones reales por fecha: 41.
Fuente (nombre):
Indicadores del desarrollo mundial
Fuente (organización):
World Bank.
Categorías:
External Debt
Se ha actualizado:
23 abr 2017 año
Los indicadores de los cambios de valor en los últimos años
Mínimo:
3.26
1 ene 2009 año
Máximo:
26.33
1 ene 1981 año
A la fecha de observación
Valor
Cambio absoluto
El cambio con respecto al valor anterior
1 ene 1975 año
5.577
+5.577
0.0%
1 ene 1976 año
5.678
+0.101
1.81%
1 ene 1977 año
6.084
+0.406
7.15%
1 ene 1978 año
6.592
+0.508
8.35%
1 ene 1979 año
14.931
+8.339
126.5%
1 ene 1980 año
16.156
+1.225
8.21%
1 ene 1981 año
26.33
+10.174
62.97%
1 ene 1982 año
12.523
-13.806
-52.44%
1 ene 1983 año
7.206
-5.317
-42.46%
1 ene 1984 año
7.094
-0.113
-1.56%
1 ene 1985 año
11.022
+3.929
55.38%
1 ene 1986 año
11.422
+0.399
3.62%
1 ene 1987 año
17.917
+6.496
56.87%
1 ene 1988 año
23.98
+6.063
33.84%
1 ene 1989 año
23.384
-0.596
-2.48%
1 ene 1990 año
21.525
-1.859
-7.95%
1 ene 1991 año
13.723
-7.802
-36.25%
1 ene 1992 año
15.879
+2.156
15.71%
1 ene 1993 año
9.073
-6.805
-42.86%
1 ene 1994 año
6.254
-2.819
-31.07%
1 ene 1995 año
13.899
+7.645
122.24%
1 ene 1996 año
13.74
-0.159
-1.15%
1 ene 1997 año
16.072
+2.332
16.97%
1 ene 1998 año
12.569
-3.503
-21.79%
1 ene 1999 año
15.554
+2.985
23.75%
1 ene 2000 año
11.923
-3.631
-23.34%
1 ene 2001 año
13.103
+1.18
9.89%
1 ene 2002 año
10.936
-2.167
-16.54%
1 ene 2003 año
11.238
+0.302
2.76%
1 ene 2004 año
9.794
-1.444
-12.85%
1 ene 2005 año
11.929
+2.135
21.8%
1 ene 2006 año
4.987
-6.942
-58.19%
1 ene 2007 año
6.127
+1.14
22.86%
1 ene 2008 año
3.46
-2.668
-43.54%
1 ene 2009 año
3.26
-0.2
-5.77%
1 ene 2010 año
4.199
+0.939
28.79%
1 ene 2011 año
4.334
+0.135
3.22%
1 ene 2012 año
6.089
+1.755
40.49%
1 ene 2013 año
5.305
-0.784
-12.88%
1 ene 2014 año
5.648
+0.344
6.48%
1 ene 2015 año
4.911
-0.737
-13.05%
Ranking de los países por los datos estadísticos actuales


Comentarios: