29
/es/
es
AIzaSyAYiBZKx7MnpbEhh9jyipgxe19OcubqV5w
April 1, 2024
262916
Thailand
THA
true
2
1
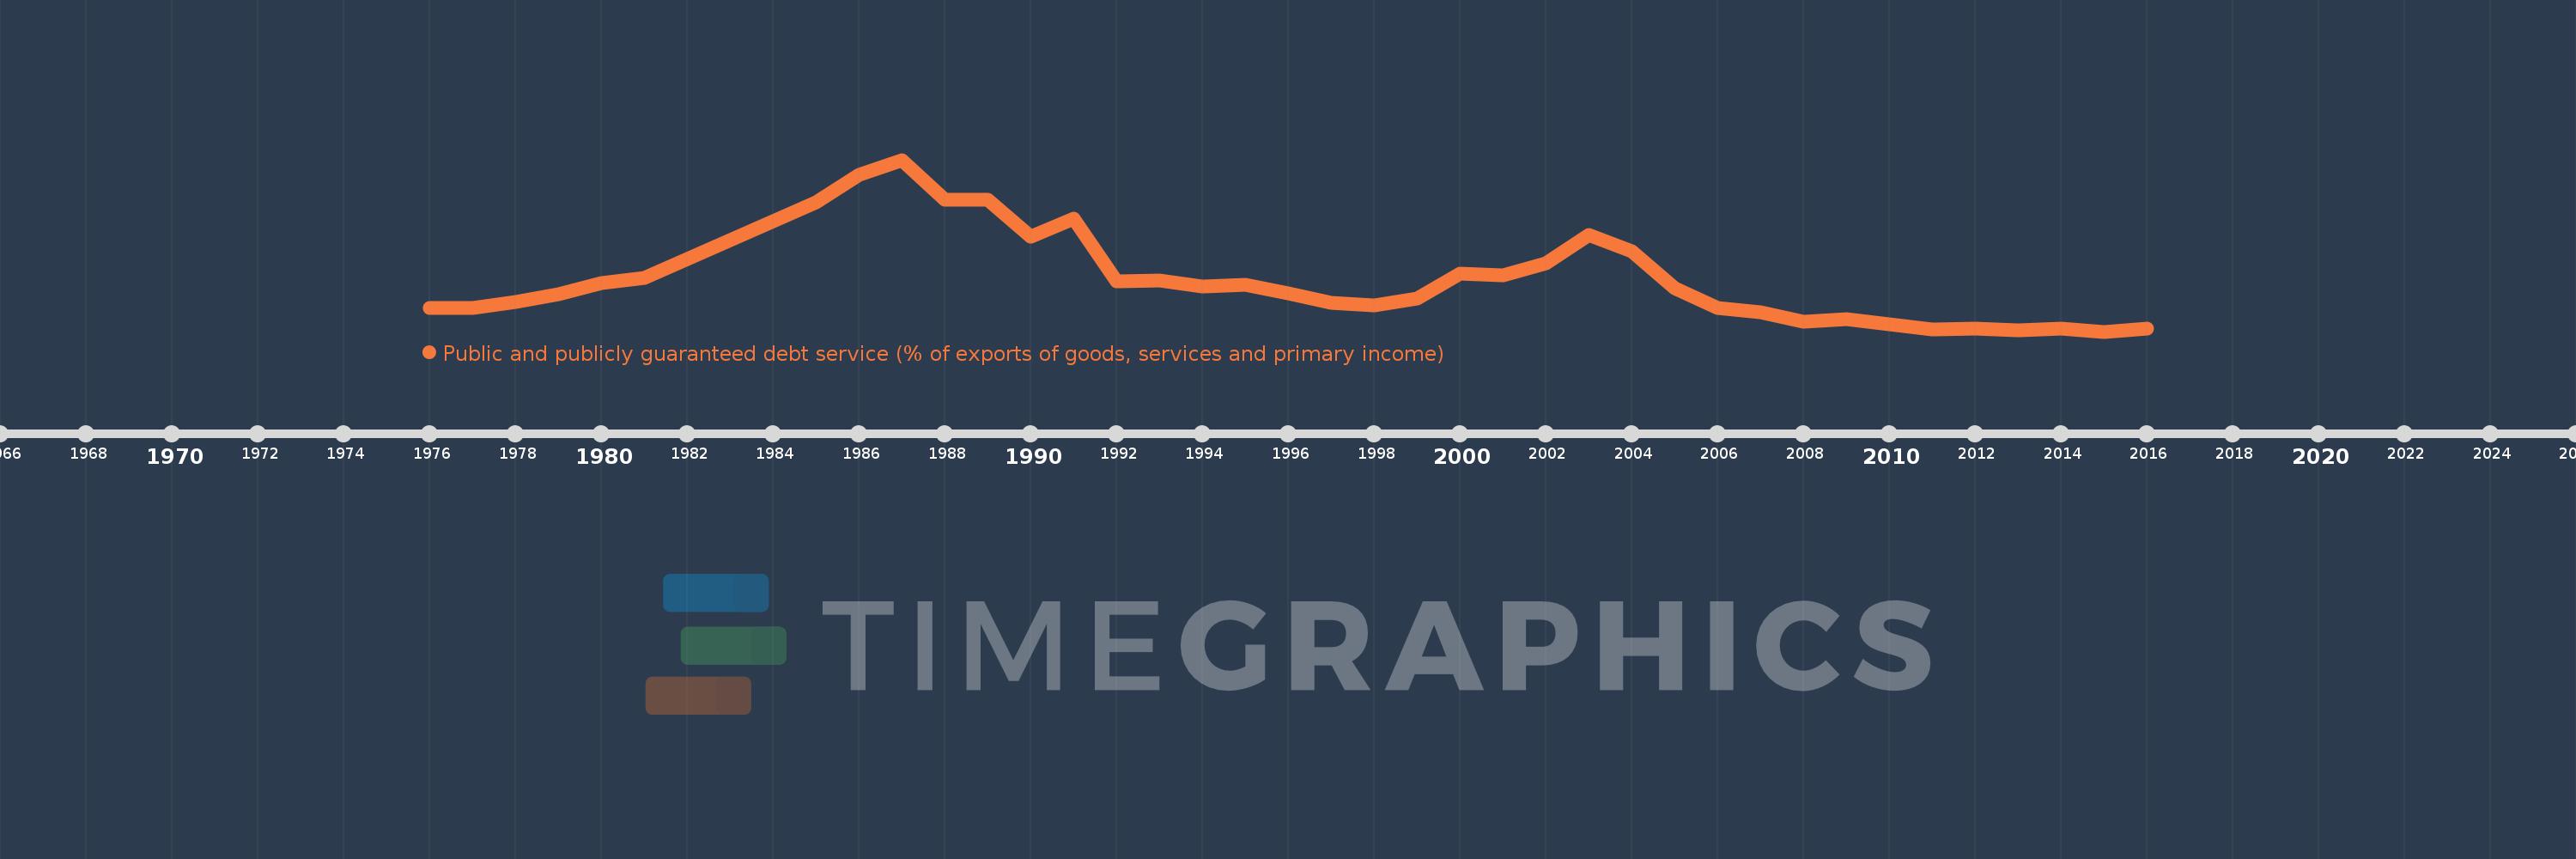
Public and publicly guaranteed debt service (% of exports of goods, services and primary income)
2016,2015,2014,2013,2012,2011,2010,2009,2008,2007,2006,2005,2004,2003,2002,2001,2000,1999,1998,1997,1996,1995,1994,1993,1992,1991,1990,1989,1988,1987,1986,1985,1984,1983,1982,1981,1980,1979,1978,1977,1976
Estas estadísticas en otros países:
línea de tiempo (timeline):
En esta escala de tiempo se presenta un gráfico de 1976 y 2016 de Thailand. Los datos de 1975 están ausentes. El número de observaciones reales por fecha: 41.
Fuente (nombre):
Indicadores del desarrollo mundial
Fuente (organización):
World Bank.
Categorías:
External Debt
Se ha actualizado:
23 abr 2017 año
Los indicadores de los cambios de valor en los últimos años
Mínimo:
0.282
1 ene 2015 año
Máximo:
15.81
1 ene 1987 año
A la fecha de observación
Valor
Cambio absoluto
El cambio con respecto al valor anterior
1 ene 1976 año
2.419
+2.419
0.0%
1 ene 1977 año
2.399
-0.02
-0.83%
1 ene 1978 año
2.926
+0.527
21.98%
1 ene 1979 año
3.656
+0.73
24.94%
1 ene 1980 año
4.702
+1.046
28.61%
1 ene 1981 año
5.14
+0.438
9.32%
1 ene 1982 año
6.854
+1.713
33.33%
1 ene 1983 año
8.567
+1.713
25.0%
1 ene 1984 año
10.229
+1.662
19.4%
1 ene 1985 año
11.961
+1.732
16.93%
1 ene 1986 año
14.473
+2.513
21.01%
1 ene 1987 año
15.81
+1.337
9.24%
1 ene 1988 año
12.221
-3.589
-22.7%
1 ene 1989 año
12.222
+0.001
0.01%
1 ene 1990 año
8.855
-3.367
-27.55%
1 ene 1991 año
10.455
+1.6
18.06%
1 ene 1992 año
4.838
-5.617
-53.72%
1 ene 1993 año
4.884
+0.046
0.95%
1 ene 1994 año
4.357
-0.527
-10.79%
1 ene 1995 año
4.534
+0.176
4.05%
1 ene 1996 año
3.742
-0.792
-17.46%
1 ene 1997 año
2.917
-0.825
-22.05%
1 ene 1998 año
2.642
-0.275
-9.43%
1 ene 1999 año
3.303
+0.661
25.03%
1 ene 2000 año
5.499
+2.196
66.49%
1 ene 2001 año
5.354
-0.145
-2.64%
1 ene 2002 año
6.426
+1.072
20.02%
1 ene 2003 año
8.982
+2.557
39.79%
1 ene 2004 año
7.553
-1.43
-15.92%
1 ene 2005 año
4.196
-3.357
-44.44%
1 ene 2006 año
2.387
-1.809
-43.1%
1 ene 2007 año
2.049
-0.338
-14.16%
1 ene 2008 año
1.158
-0.891
-43.49%
1 ene 2009 año
1.395
+0.237
20.49%
1 ene 2010 año
0.978
-0.418
-29.95%
1 ene 2011 año
0.444
-0.533
-54.58%
1 ene 2012 año
0.542
+0.098
21.99%
1 ene 2013 año
0.408
-0.133
-24.58%
1 ene 2014 año
0.528
+0.119
29.16%
1 ene 2015 año
0.282
-0.245
-46.46%
1 ene 2016 año
0.539
+0.256
90.69%
Ranking de los países por los datos estadísticos actuales


Comentarios: