29
/es/
es
AIzaSyAYiBZKx7MnpbEhh9jyipgxe19OcubqV5w
April 1, 2024
261545
Tanzania
TZA
true
2
1
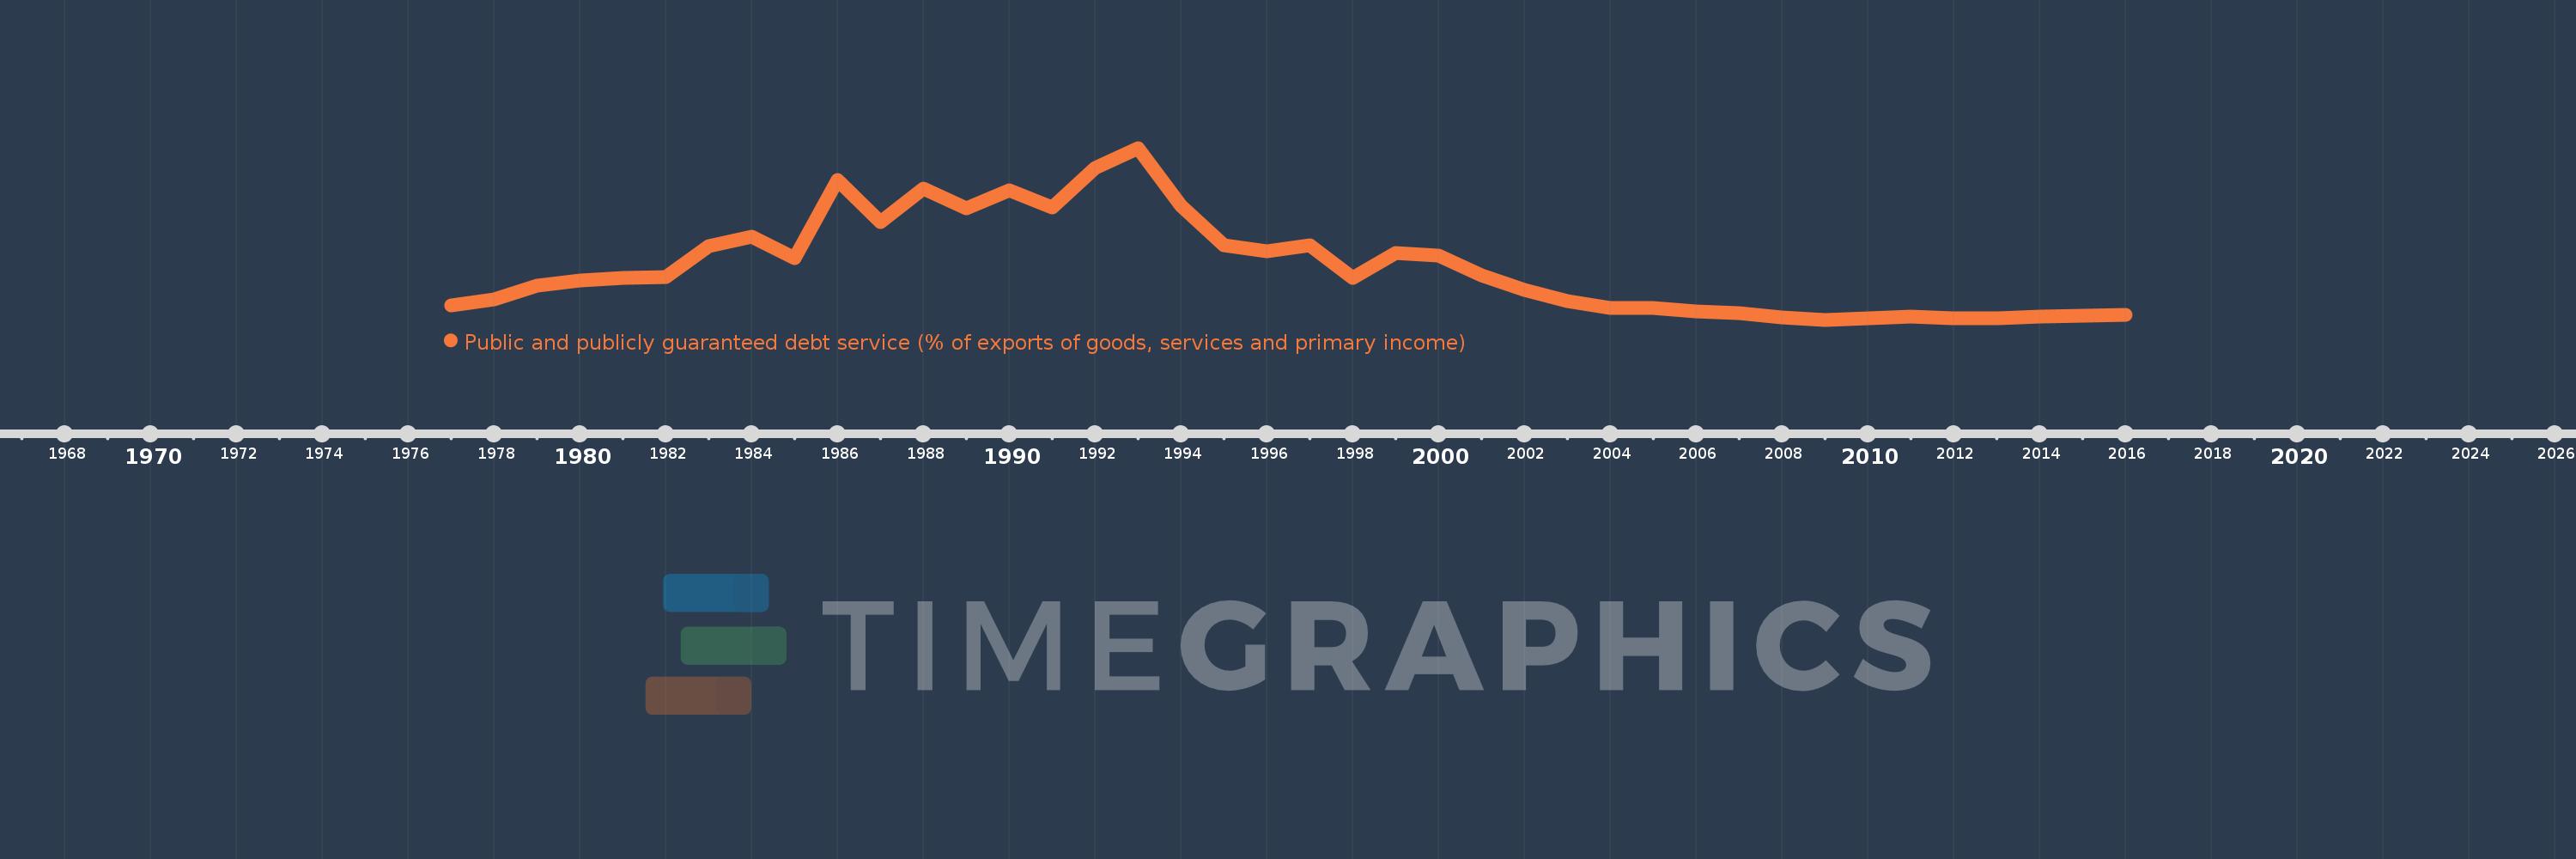
Public and publicly guaranteed debt service (% of exports of goods, services and primary income)
2016,2015,2014,2013,2012,2011,2010,2009,2008,2007,2006,2005,2004,2003,2002,2001,2000,1999,1998,1997,1996,1995,1994,1993,1992,1991,1990,1989,1988,1987,1986,1985,1984,1983,1982,1981,1980,1979,1978,1977
Estas estadísticas en otros países:
línea de tiempo (timeline):
En esta escala de tiempo se presenta un gráfico de 1977 y 2016 de Tanzania. Los datos de 1976 están ausentes. El número de observaciones reales por fecha: 40.
Fuente (nombre):
Indicadores del desarrollo mundial
Fuente (organización):
World Bank.
Categorías:
External Debt
Se ha actualizado:
23 abr 2017 año
Los indicadores de los cambios de valor en los últimos años
Mínimo:
0.595
1 ene 2009 año
Máximo:
38.156
1 ene 1993 año
A la fecha de observación
Valor
Cambio absoluto
El cambio con respecto al valor anterior
1 ene 1977 año
3.76
+3.76
0.0%
1 ene 1978 año
5.107
+1.347
35.81%
1 ene 1979 año
8.034
+2.927
57.32%
1 ene 1980 año
9.096
+1.062
13.22%
1 ene 1981 año
9.679
+0.583
6.41%
1 ene 1982 año
9.919
+0.239
2.47%
1 ene 1983 año
16.611
+6.693
67.47%
1 ene 1984 año
18.77
+2.159
12.99%
1 ene 1985 año
14.003
-4.767
-25.4%
1 ene 1986 año
31.221
+17.219
122.97%
1 ene 1987 año
21.959
-9.262
-29.67%
1 ene 1988 año
29.29
+7.33
33.38%
1 ene 1989 año
24.936
-4.354
-14.87%
1 ene 1990 año
28.92
+3.985
15.98%
1 ene 1991 año
25.074
-3.846
-13.3%
1 ene 1992 año
33.7
+8.626
34.4%
1 ene 1993 año
38.156
+4.456
13.22%
1 ene 1994 año
25.443
-12.712
-33.32%
1 ene 1995 año
16.797
-8.646
-33.98%
1 ene 1996 año
15.573
-1.224
-7.29%
1 ene 1997 año
16.816
+1.243
7.98%
1 ene 1998 año
9.701
-7.115
-42.31%
1 ene 1999 año
15.212
+5.511
56.81%
1 ene 2000 año
14.664
-0.549
-3.61%
1 ene 2001 año
10.282
-4.381
-29.88%
1 ene 2002 año
7.201
-3.082
-29.97%
1 ene 2003 año
4.662
-2.538
-35.25%
1 ene 2004 año
3.244
-1.418
-30.42%
1 ene 2005 año
3.116
-0.128
-3.95%
1 ene 2006 año
2.391
-0.725
-23.26%
1 ene 2007 año
2.079
-0.313
-13.08%
1 ene 2008 año
1.023
-1.055
-50.76%
1 ene 2009 año
0.595
-0.429
-41.9%
1 ene 2010 año
0.999
+0.404
68.02%
1 ene 2011 año
1.292
+0.293
29.3%
1 ene 2012 año
0.945
-0.347
-26.87%
1 ene 2013 año
0.877
-0.067
-7.11%
1 ene 2014 año
1.383
+0.505
57.56%
1 ene 2015 año
1.462
+0.079
5.74%
1 ene 2016 año
1.644
+0.182
12.43%
Ranking de los países por los datos estadísticos actuales


Comentarios: