29
/es/
es
AIzaSyAYiBZKx7MnpbEhh9jyipgxe19OcubqV5w
April 1, 2024
212323
Niger
NER
true
2
1
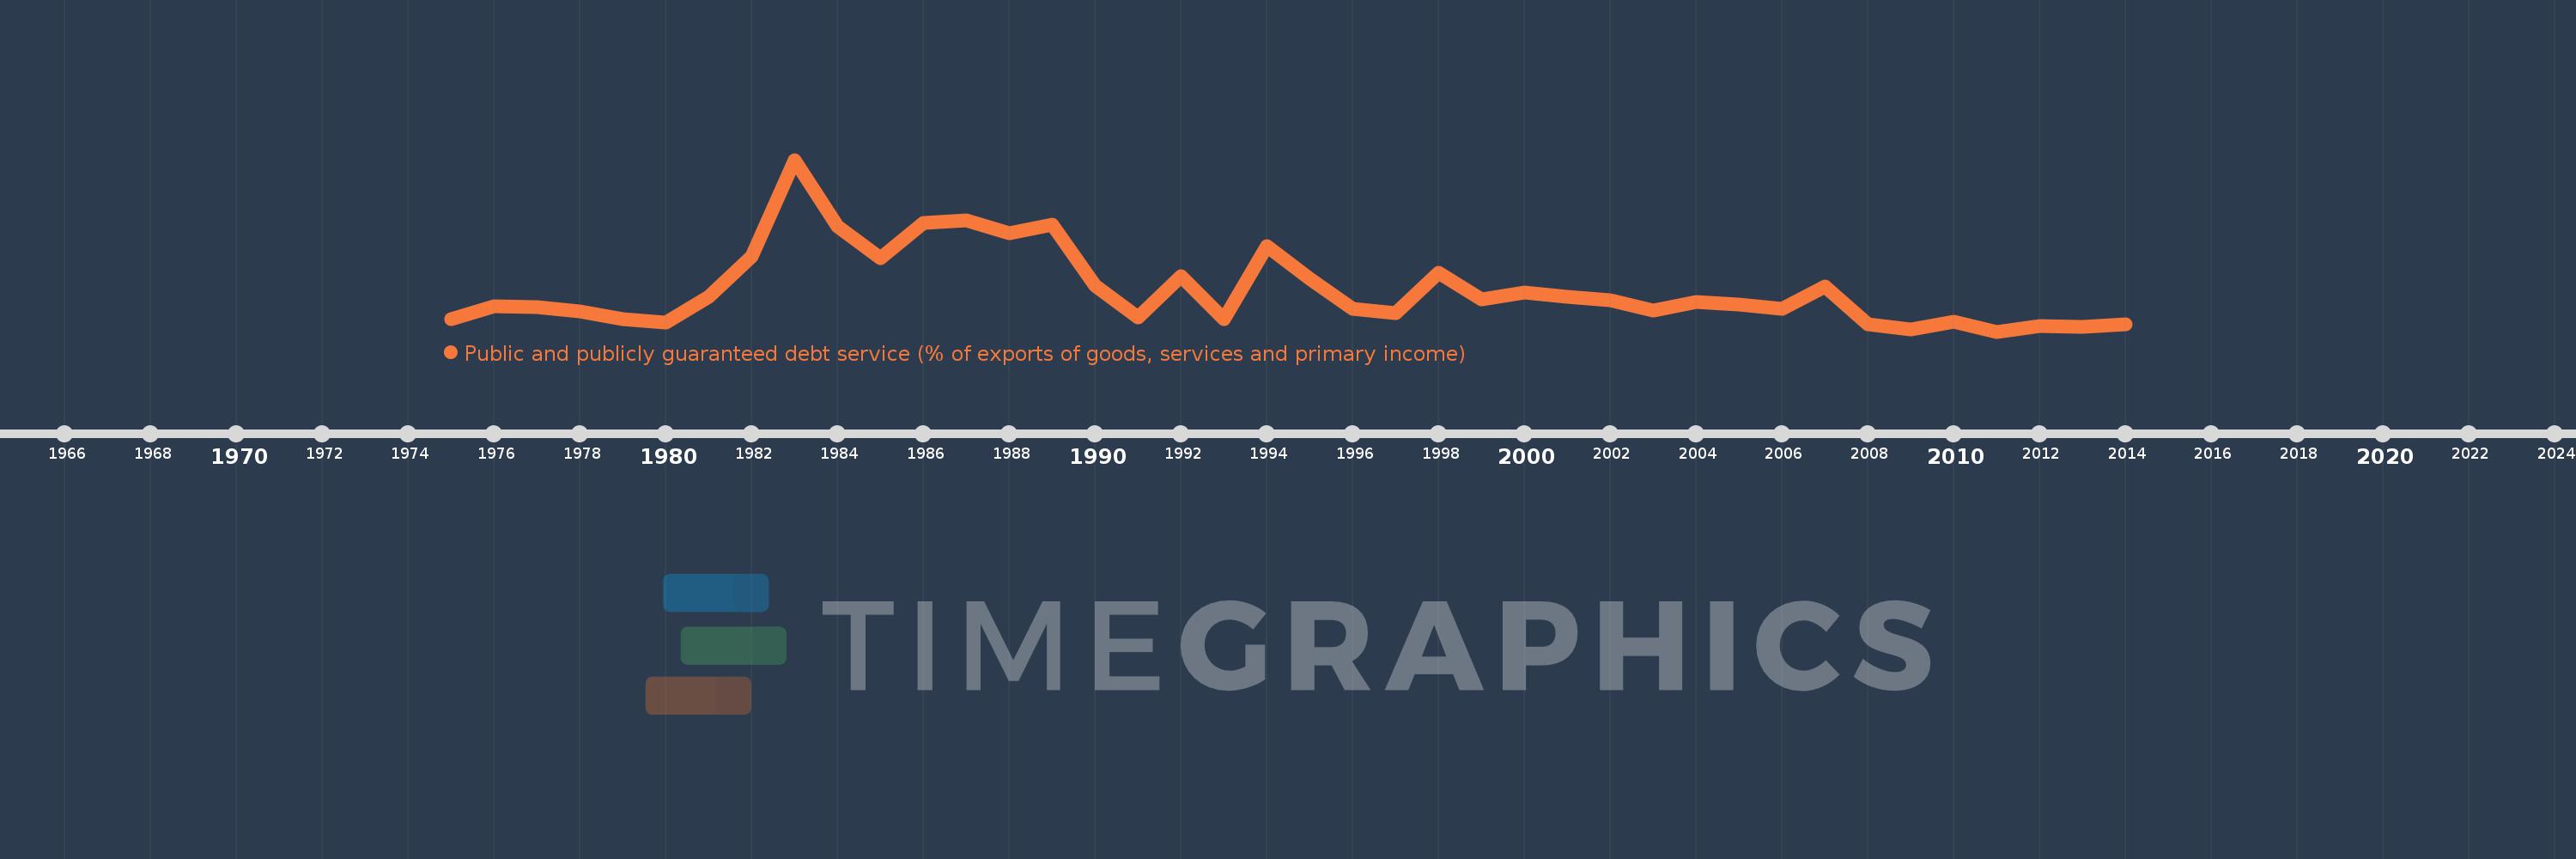
Public and publicly guaranteed debt service (% of exports of goods, services and primary income)
2014,2013,2012,2011,2010,2009,2008,2007,2006,2005,2004,2003,2002,2001,2000,1999,1998,1997,1996,1995,1994,1993,1992,1991,1990,1989,1988,1987,1986,1985,1984,1983,1982,1981,1980,1979,1978,1977,1976,1975
Estas estadísticas en otros países:
línea de tiempo (timeline):
En esta escala de tiempo se presenta un gráfico de 1975 y 2014 de Niger. Los datos de 1974 están ausentes. El número de observaciones reales por fecha: 40.
Fuente (nombre):
Indicadores del desarrollo mundial
Fuente (organización):
World Bank.
Categorías:
External Debt
Se ha actualizado:
23 abr 2017 año
Los indicadores de los cambios de valor en los últimos años
Mínimo:
1.139
1 ene 2011 año
Máximo:
25.174
1 ene 1983 año
A la fecha de observación
Valor
Cambio absoluto
El cambio con respecto al valor anterior
1 ene 1975 año
2.87
+2.87
0.0%
1 ene 1976 año
4.711
+1.841
64.16%
1 ene 1977 año
4.516
-0.195
-4.15%
1 ene 1978 año
3.944
-0.571
-12.65%
1 ene 1979 año
2.829
-1.116
-28.28%
1 ene 1980 año
2.456
-0.373
-13.18%
1 ene 1981 año
6.047
+3.591
146.22%
1 ene 1982 año
11.61
+5.564
92.01%
1 ene 1983 año
25.174
+13.564
116.82%
1 ene 1984 año
15.866
-9.308
-36.97%
1 ene 1985 año
11.419
-4.447
-28.03%
1 ene 1986 año
16.371
+4.951
43.36%
1 ene 1987 año
16.718
+0.347
2.12%
1 ene 1988 año
14.852
-1.866
-11.16%
1 ene 1989 año
16.125
+1.273
8.57%
1 ene 1990 año
7.516
-8.61
-53.39%
1 ene 1991 año
3.153
-4.362
-58.04%
1 ene 1992 año
8.948
+5.794
183.74%
1 ene 1993 año
2.825
-6.122
-68.42%
1 ene 1994 año
13.041
+10.216
361.59%
1 ene 1995 año
8.569
-4.472
-34.29%
1 ene 1996 año
4.326
-4.244
-49.52%
1 ene 1997 año
3.77
-0.555
-12.84%
1 ene 1998 año
9.325
+5.555
147.32%
1 ene 1999 año
5.611
-3.714
-39.83%
1 ene 2000 año
6.603
+0.993
17.69%
1 ene 2001 año
6.03
-0.574
-8.69%
1 ene 2002 año
5.549
-0.48
-7.97%
1 ene 2003 año
4.042
-1.507
-27.17%
1 ene 2004 año
5.239
+1.198
29.64%
1 ene 2005 año
4.949
-0.291
-5.55%
1 ene 2006 año
4.362
-0.586
-11.85%
1 ene 2007 año
7.4
+3.038
69.64%
1 ene 2008 año
2.186
-5.215
-70.47%
1 ene 2009 año
1.4
-0.786
-35.97%
1 ene 2010 año
2.538
+1.139
81.36%
1 ene 2011 año
1.139
-1.399
-55.14%
1 ene 2012 año
1.95
+0.811
71.22%
1 ene 2013 año
1.761
-0.189
-9.67%
1 ene 2014 año
2.185
+0.424
24.1%
Ranking de los países por los datos estadísticos actuales


Comentarios: