29
/es/
es
AIzaSyAYiBZKx7MnpbEhh9jyipgxe19OcubqV5w
April 1, 2024
40291
IDA total
IDA
false
2
1
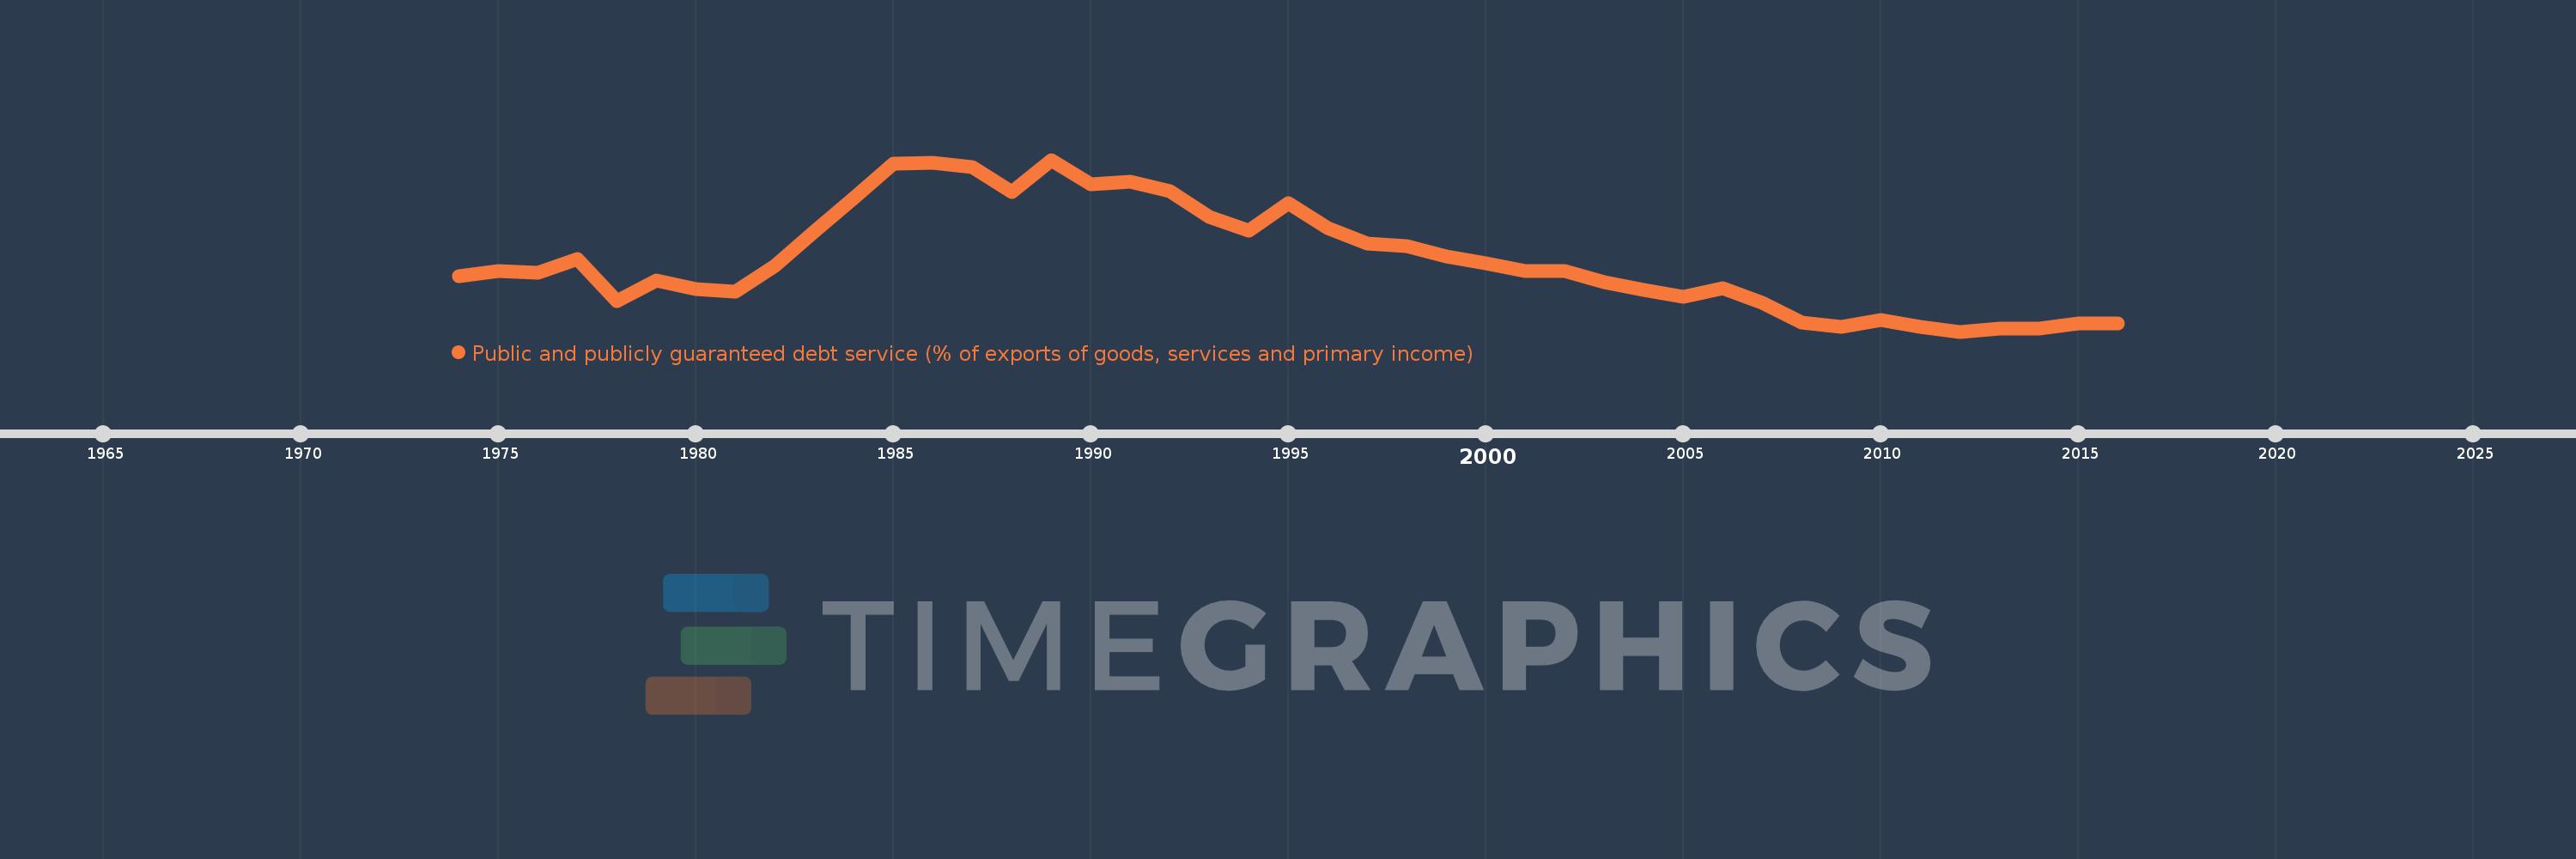
Public and publicly guaranteed debt service (% of exports of goods, services and primary income)
2016,2015,2014,2013,2012,2011,2010,2009,2008,2007,2006,2005,2004,2003,2002,2001,2000,1999,1998,1997,1996,1995,1994,1993,1992,1991,1990,1989,1988,1987,1986,1985,1984,1983,1982,1981,1980,1979,1978,1977,1976,1975,1974
Estas estadísticas en otros países:
línea de tiempo (timeline):
En esta escala de tiempo se presenta un gráfico de 1974 y 2016 de IDA total. Los datos de 1973 están ausentes. El número de observaciones reales por fecha: 43.
Fuente (nombre):
Indicadores del desarrollo mundial
Fuente (organización):
World Bank.
Categorías:
External Debt
Se ha actualizado:
23 abr 2017 año
Los indicadores de los cambios de valor en los últimos años
Mínimo:
2.441
1 ene 2012 año
Máximo:
21.547
1 ene 1989 año
A la fecha de observación
Valor
Cambio absoluto
El cambio con respecto al valor anterior
1 ene 1974 año
8.6
+8.6
0.0%
1 ene 1975 año
9.137
+0.537
6.25%
1 ene 1976 año
8.957
-0.18
-1.97%
1 ene 1977 año
10.482
+1.525
17.02%
1 ene 1978 año
5.878
-4.603
-43.92%
1 ene 1979 año
8.114
+2.235
38.03%
1 ene 1980 año
7.174
-0.94
-11.58%
1 ene 1981 año
6.853
-0.321
-4.48%
1 ene 1982 año
9.736
+2.884
42.08%
1 ene 1983 año
13.582
+3.845
39.49%
1 ene 1984 año
17.29
+3.708
27.3%
1 ene 1985 año
21.142
+3.852
22.28%
1 ene 1986 año
21.209
+0.067
0.32%
1 ene 1987 año
20.775
-0.434
-2.05%
1 ene 1988 año
17.951
-2.824
-13.59%
1 ene 1989 año
21.547
+3.596
20.03%
1 ene 1990 año
18.79
-2.757
-12.8%
1 ene 1991 año
19.116
+0.326
1.74%
1 ene 1992 año
18.106
-1.01
-5.28%
1 ene 1993 año
15.222
-2.884
-15.93%
1 ene 1994 año
13.702
-1.521
-9.99%
1 ene 1995 año
16.739
+3.037
22.17%
1 ene 1996 año
13.977
-2.762
-16.5%
1 ene 1997 año
12.189
-1.787
-12.79%
1 ene 1998 año
11.95
-0.24
-1.97%
1 ene 1999 año
10.82
-1.129
-9.45%
1 ene 2000 año
10.03
-0.79
-7.3%
1 ene 2001 año
9.157
-0.873
-8.7%
1 ene 2002 año
9.171
+0.014
0.15%
1 ene 2003 año
7.958
-1.214
-13.23%
1 ene 2004 año
7.114
-0.843
-10.6%
1 ene 2005 año
6.356
-0.758
-10.66%
1 ene 2006 año
7.29
+0.934
14.7%
1 ene 2007 año
5.596
-1.694
-23.24%
1 ene 2008 año
3.488
-2.108
-37.67%
1 ene 2009 año
2.989
-0.499
-14.3%
1 ene 2010 año
3.719
+0.73
24.42%
1 ene 2011 año
2.984
-0.735
-19.77%
1 ene 2012 año
2.441
-0.543
-18.18%
1 ene 2013 año
2.797
+0.356
14.58%
1 ene 2014 año
2.739
-0.058
-2.07%
1 ene 2015 año
3.309
+0.57
20.81%
1 ene 2016 año
3.319
+0.009
0.29%
Ranking de los países por los datos estadísticos actuales


Comentarios: