29
/it/
it
AIzaSyAYiBZKx7MnpbEhh9jyipgxe19OcubqV5w
April 1, 2024
205860
Namibia
NAM
true
2
1
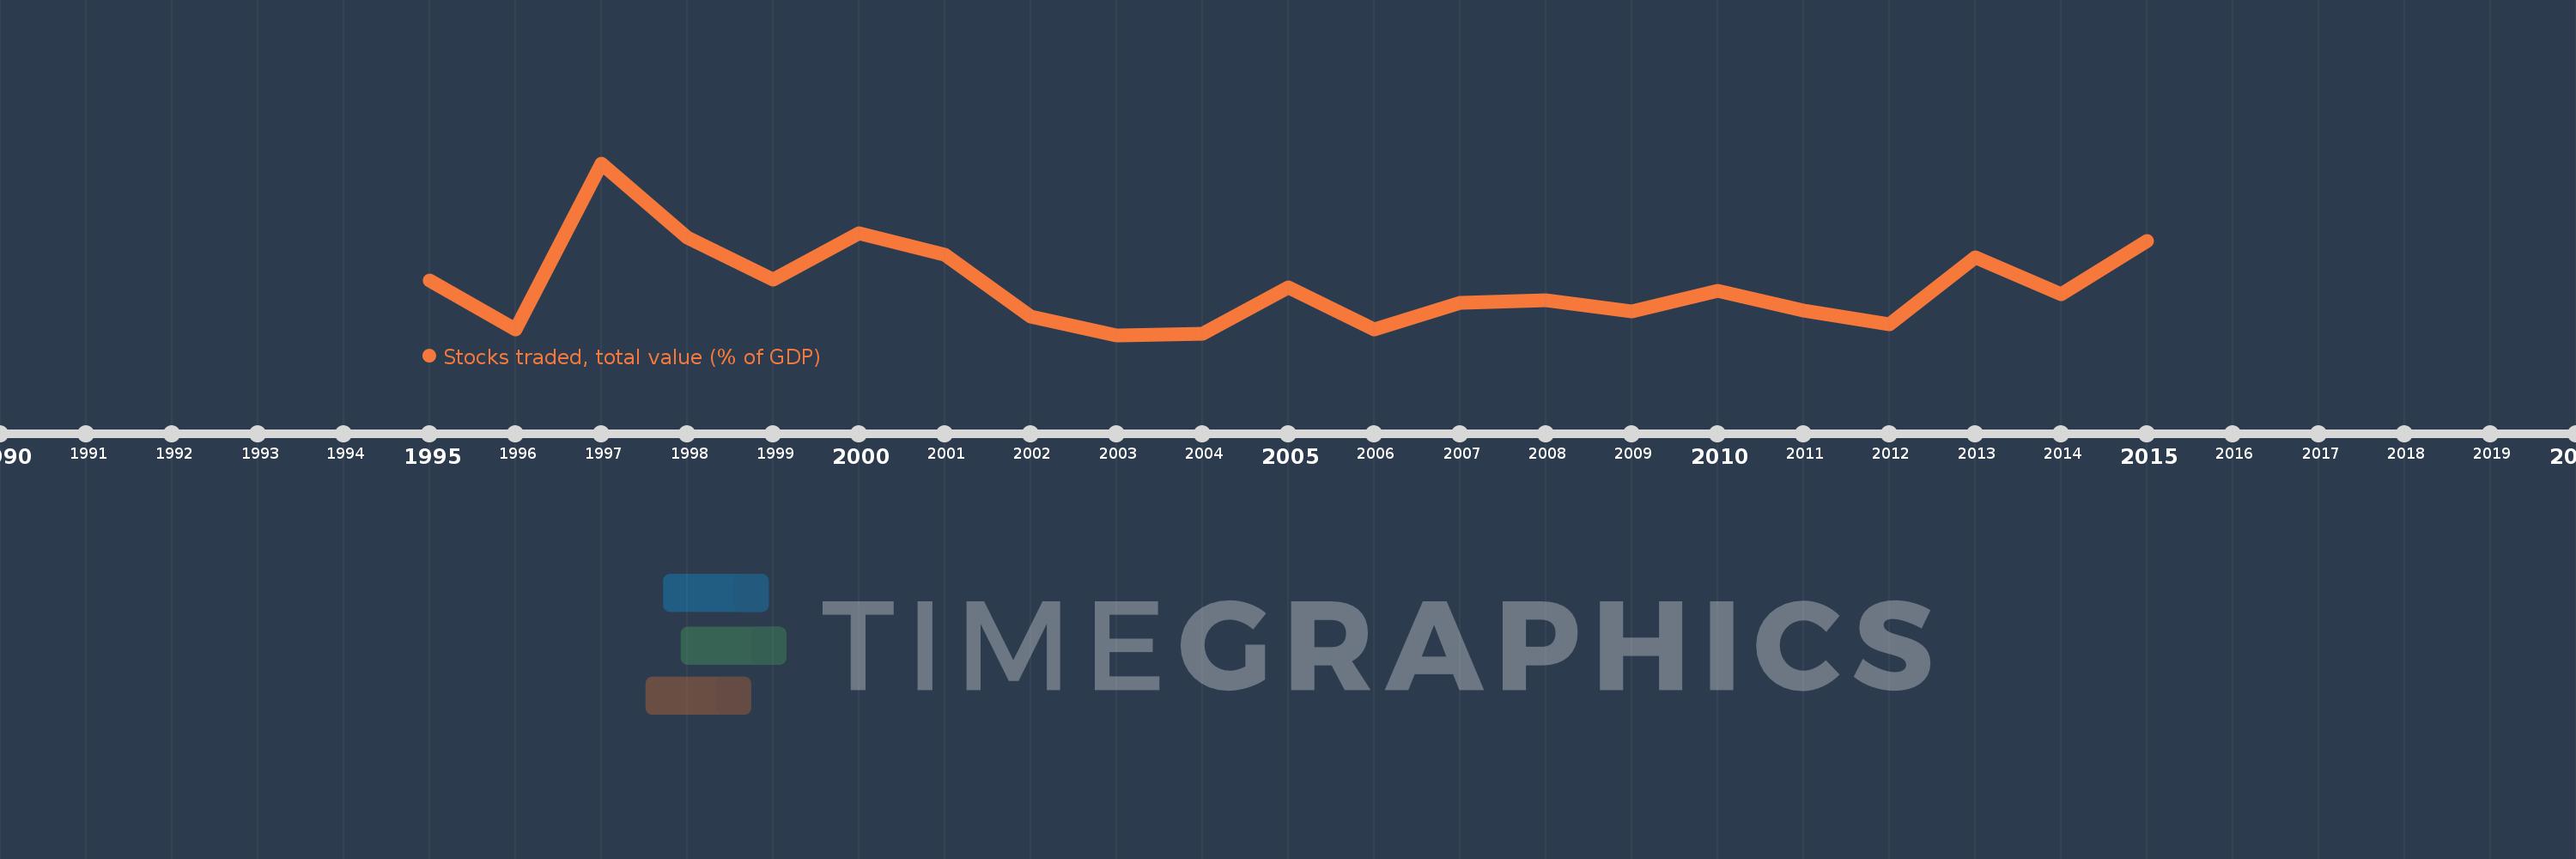
Stocks traded, total value (% of GDP)
2015,2014,2013,2012,2011,2010,2009,2008,2007,2006,2005,2004,2003,2002,2001,2000,1999,1998,1997,1996,1995
Queste statistiche in altri paesi:
Linea del tempo:
Questa scala temporale mostra un grafico dal 1995 anno al 2015 anno. Namibia. I dati fino ad 1994 anno non disponibili. Il numero di osservazioni attuali secondo i date: 21.
La fonte (nome):
Indicatori dello sviluppo mondiale
La fonte (organizzazione):
World Federation of Exchanges database.
Categorie:
Financial Sector
sono stati aggiornati
23 apr 2017 anni
Indicatori delle variazioni dei valori per anni
Minima:
0.048
1 gen 2003 anni
Massimo:
0.956
1 gen 1997 anni
Alla data di osservazione
Valore
Variazione assoluta
La variazione rispetto al valore precedente
1 gen 1995 anni
0.335
+0.335
0.0%
1 gen 1996 anni
0.076
-0.26
-77.39%
1 gen 1997 anni
0.956
+0.88
1.16 Mille.%
1 gen 1998 anni
0.563
-0.393
-41.09%
1 gen 1999 anni
0.339
-0.224
-39.75%
1 gen 2000 anni
0.586
+0.247
72.76%
1 gen 2001 anni
0.474
-0.112
-19.15%
1 gen 2002 anni
0.147
-0.327
-69.06%
1 gen 2003 anni
0.048
-0.098
-67.13%
1 gen 2004 anni
0.056
+0.007
15.29%
1 gen 2005 anni
0.301
+0.245
441.54%
1 gen 2006 anni
0.076
-0.225
-74.74%
1 gen 2007 anni
0.217
+0.141
185.23%
1 gen 2008 anni
0.234
+0.017
8.06%
1 gen 2009 anni
0.173
-0.062
-26.32%
1 gen 2010 anni
0.282
+0.109
63.1%
1 gen 2011 anni
0.179
-0.102
-36.25%
1 gen 2012 anni
0.103
-0.077
-42.71%
1 gen 2013 anni
0.46
+0.357
347.56%
1 gen 2014 anni
0.264
-0.196
-42.57%
1 gen 2015 anni
0.543
+0.279
105.52%
Classificazione dei paesi secondo i statistiche attuali per anni


Commenti: