29
/it/
it
AIzaSyAYiBZKx7MnpbEhh9jyipgxe19OcubqV5w
April 1, 2024
214818
Norway
NOR
true
2
1
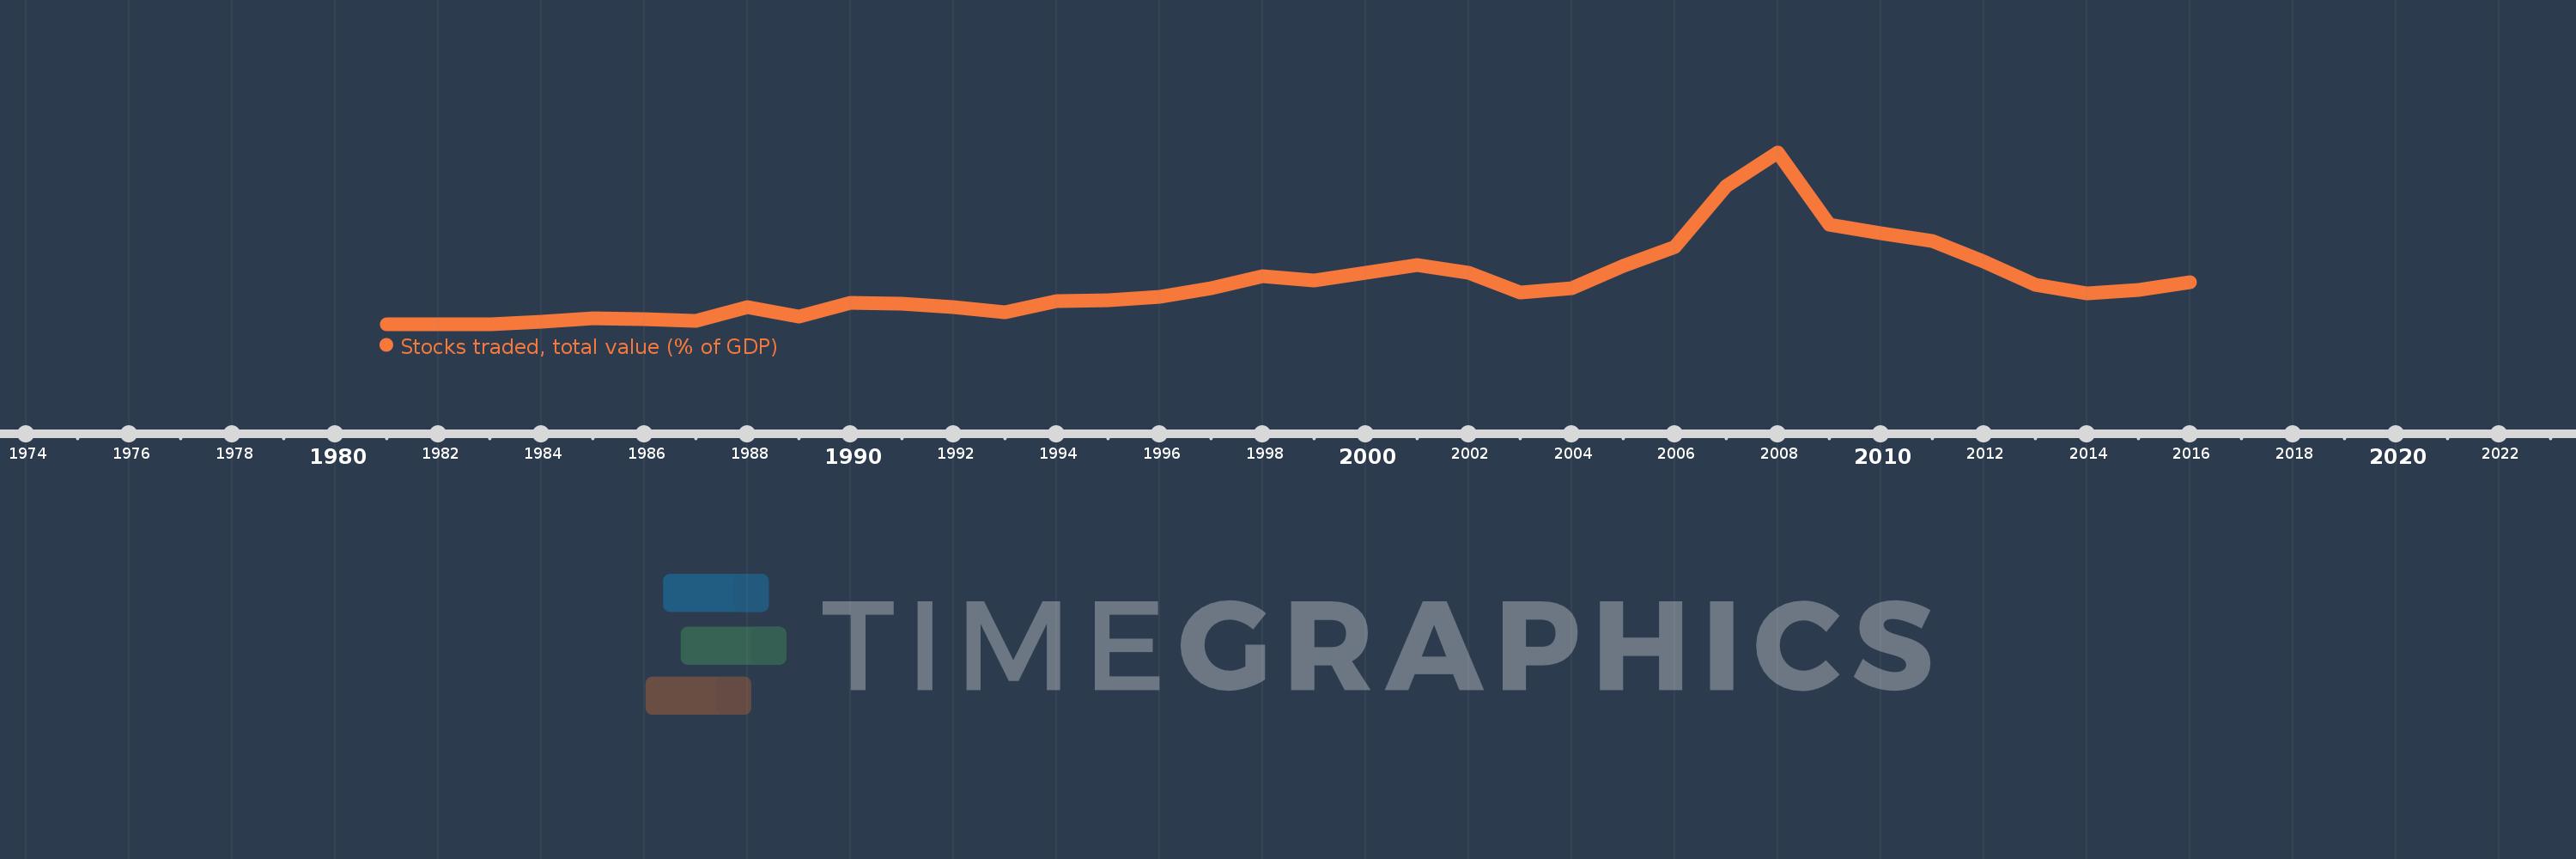
Stocks traded, total value (% of GDP)
2016,2015,2014,2013,2012,2011,2010,2009,2008,2007,2006,2005,2004,2003,2002,2001,2000,1999,1998,1997,1996,1995,1994,1993,1992,1991,1990,1989,1988,1987,1986,1985,1984,1983,1982,1981
Queste statistiche in altri paesi:
Linea del tempo:
Questa scala temporale mostra un grafico dal 1981 anno al 2016 anno. Norway. I dati fino ad 1980 anno non disponibili. Il numero di osservazioni attuali secondo i date: 36.
La fonte (nome):
Indicatori dello sviluppo mondiale
La fonte (organizzazione):
World Federation of Exchanges database.
Categorie:
Financial Sector
sono stati aggiornati
23 apr 2017 anni
Indicatori delle variazioni dei valori per anni
Minima:
0.13
1 gen 1981 anni
Massimo:
101.734
1 gen 2008 anni
Alla data di osservazione
Valore
Variazione assoluta
La variazione rispetto al valore precedente
1 gen 1981 anni
0.13
+0.13
0.0%
1 gen 1982 anni
0.156
+0.026
20.03%
1 gen 1983 anni
0.139
-0.017
-10.86%
1 gen 1984 anni
1.471
+1.331
954.51%
1 gen 1985 anni
3.538
+2.068
140.57%
1 gen 1986 anni
3.252
-0.286
-8.08%
1 gen 1987 anni
2.161
-1.092
-33.57%
1 gen 1988 anni
10.237
+8.076
373.78%
1 gen 1989 anni
4.725
-5.512
-53.84%
1 gen 1990 anni
12.696
+7.971
168.69%
1 gen 1991 anni
12.38
-0.316
-2.49%
1 gen 1992 anni
10.347
-2.033
-16.42%
1 gen 1993 anni
6.971
-3.376
-32.63%
1 gen 1994 anni
13.791
+6.821
97.85%
1 gen 1995 anni
14.3
+0.509
3.69%
1 gen 1996 anni
16.107
+1.807
12.63%
1 gen 1997 anni
21.647
+5.54
34.4%
1 gen 1998 anni
28.38
+6.733
31.1%
1 gen 1999 anni
25.829
-2.55
-8.99%
1 gen 2000 anni
30.742
+4.913
19.02%
1 gen 2001 anni
35.231
+4.488
14.6%
1 gen 2002 anni
30.369
-4.862
-13.8%
1 gen 2003 anni
18.673
-11.696
-38.51%
1 gen 2004 anni
21.373
+2.699
14.46%
1 gen 2005 anni
34.622
+13.249
61.99%
1 gen 2006 anni
45.908
+11.287
32.6%
1 gen 2007 anni
81.881
+35.973
78.36%
1 gen 2008 anni
101.734
+19.853
24.25%
1 gen 2009 anni
58.821
-42.914
-42.18%
1 gen 2010 anni
53.753
-5.068
-8.62%
1 gen 2011 anni
49.477
-4.276
-7.95%
1 gen 2012 anni
37.095
-12.382
-25.03%
1 gen 2013 anni
23.466
-13.629
-36.74%
1 gen 2014 anni
18.466
-5.0
-21.31%
1 gen 2015 anni
20.534
+2.068
11.2%
1 gen 2016 anni
24.833
+4.299
20.93%
Classificazione dei paesi secondo i statistiche attuali per anni


Commenti: