29
/it/
it
AIzaSyAYiBZKx7MnpbEhh9jyipgxe19OcubqV5w
April 1, 2024
36206
High income
HIC
false
2
1
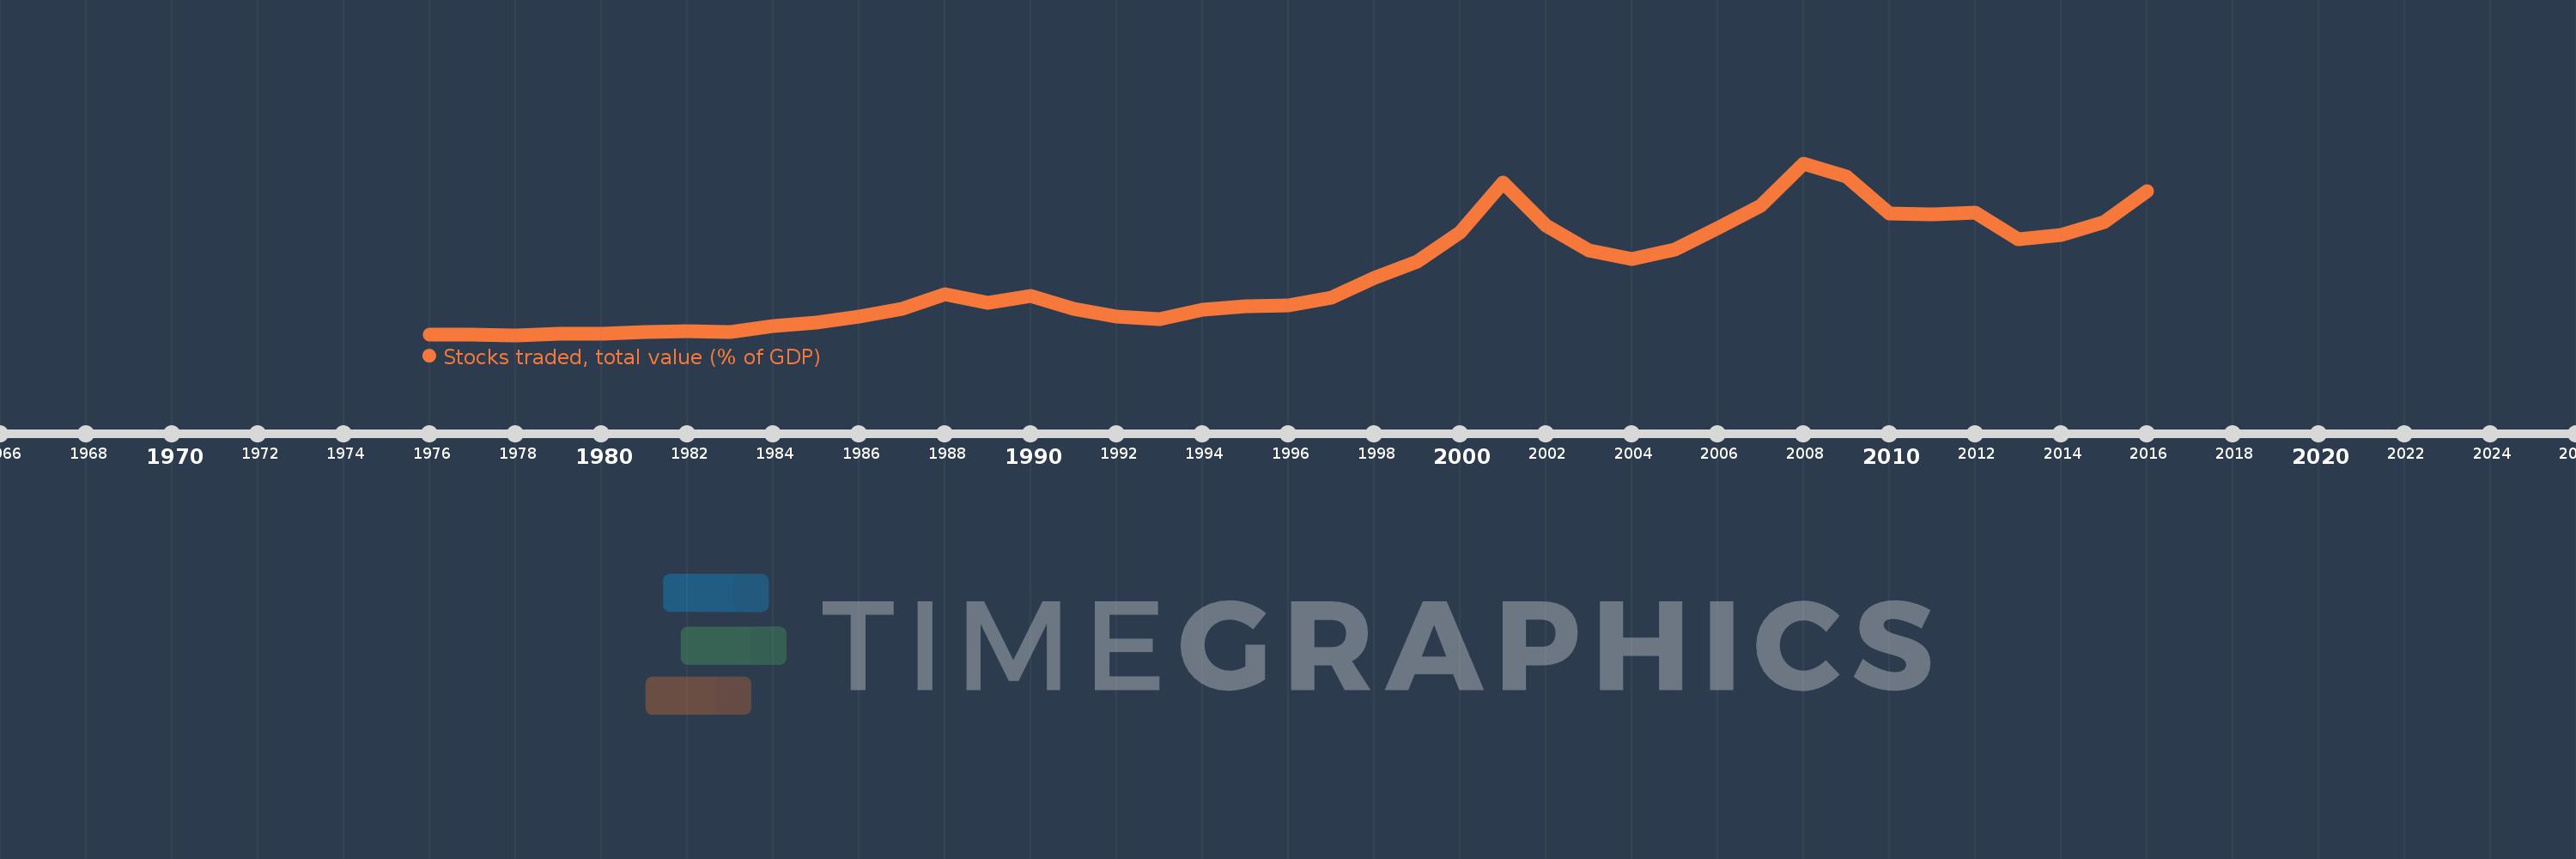
Stocks traded, total value (% of GDP)
2016,2015,2014,2013,2012,2011,2010,2009,2008,2007,2006,2005,2004,2003,2002,2001,2000,1999,1998,1997,1996,1995,1994,1993,1992,1991,1990,1989,1988,1987,1986,1985,1984,1983,1982,1981,1980,1979,1978,1977,1976
Queste statistiche in altri paesi:
Linea del tempo:
Questa scala temporale mostra un grafico dal 1976 anno al 2016 anno. High income. I dati fino ad 1975 anno non disponibili. Il numero di osservazioni attuali secondo i date: 41.
La fonte (nome):
Indicatori dello sviluppo mondiale
La fonte (organizzazione):
World Federation of Exchanges database.
Categorie:
Financial Sector
sono stati aggiornati
23 apr 2017 anni
Indicatori delle variazioni dei valori per anni
Minima:
6.242
1 gen 1978 anni
Massimo:
186.41
1 gen 2008 anni
Alla data di osservazione
Valore
Variazione assoluta
La variazione rispetto al valore precedente
1 gen 1976 anni
6.243
+6.243
0.0%
1 gen 1977 anni
7.013
+0.771
12.35%
1 gen 1978 anni
6.242
-0.771
-11.0%
1 gen 1979 anni
7.921
+1.678
26.89%
1 gen 1980 anni
7.239
-0.681
-8.6%
1 gen 1981 anni
9.534
+2.295
31.7%
1 gen 1982 anni
10.423
+0.889
9.32%
1 gen 1983 anni
9.497
-0.926
-8.88%
1 gen 1984 anni
15.666
+6.169
64.95%
1 gen 1985 anni
18.891
+3.225
20.58%
1 gen 1986 anni
25.237
+6.346
33.59%
1 gen 1987 anni
34.107
+8.871
35.15%
1 gen 1988 anni
49.351
+15.243
44.69%
1 gen 1989 anni
40.246
-9.105
-18.45%
1 gen 1990 anni
47.1
+6.854
17.03%
1 gen 1991 anni
33.725
-13.375
-28.4%
1 gen 1992 anni
25.627
-8.099
-24.01%
1 gen 1993 anni
23.282
-2.344
-9.15%
1 gen 1994 anni
32.625
+9.342
40.13%
1 gen 1995 anni
36.112
+3.488
10.69%
1 gen 1996 anni
37.342
+1.23
3.41%
1 gen 1997 anni
45.256
+7.913
21.19%
1 gen 1998 anni
65.713
+20.457
45.2%
1 gen 1999 anni
83.039
+17.326
26.37%
1 gen 2000 anni
114.211
+31.172
37.54%
1 gen 2001 anni
165.962
+51.751
45.31%
1 gen 2002 anni
121.363
-44.599
-26.87%
1 gen 2003 anni
94.987
-26.376
-21.73%
1 gen 2004 anni
86.321
-8.666
-9.12%
1 gen 2005 anni
95.945
+9.624
11.15%
1 gen 2006 anni
118.145
+22.2
23.14%
1 gen 2007 anni
141.43
+23.285
19.71%
1 gen 2008 anni
186.41
+44.98
31.8%
1 gen 2009 anni
172.385
-14.025
-7.52%
1 gen 2010 anni
133.346
-39.039
-22.65%
1 gen 2011 anni
133.235
-0.11
-0.08%
1 gen 2012 anni
134.252
+1.017
0.76%
1 gen 2013 anni
106.604
-27.648
-20.59%
1 gen 2014 anni
111.579
+4.975
4.67%
1 gen 2015 anni
124.695
+13.116
11.76%
1 gen 2016 anni
157.465
+32.77
26.28%
Classificazione dei paesi secondo i statistiche attuali per anni


Commenti: