29
/it/
it
AIzaSyAYiBZKx7MnpbEhh9jyipgxe19OcubqV5w
April 1, 2024
43025
Latin America & Caribbean (excluding high income)
LAC
false
2
1
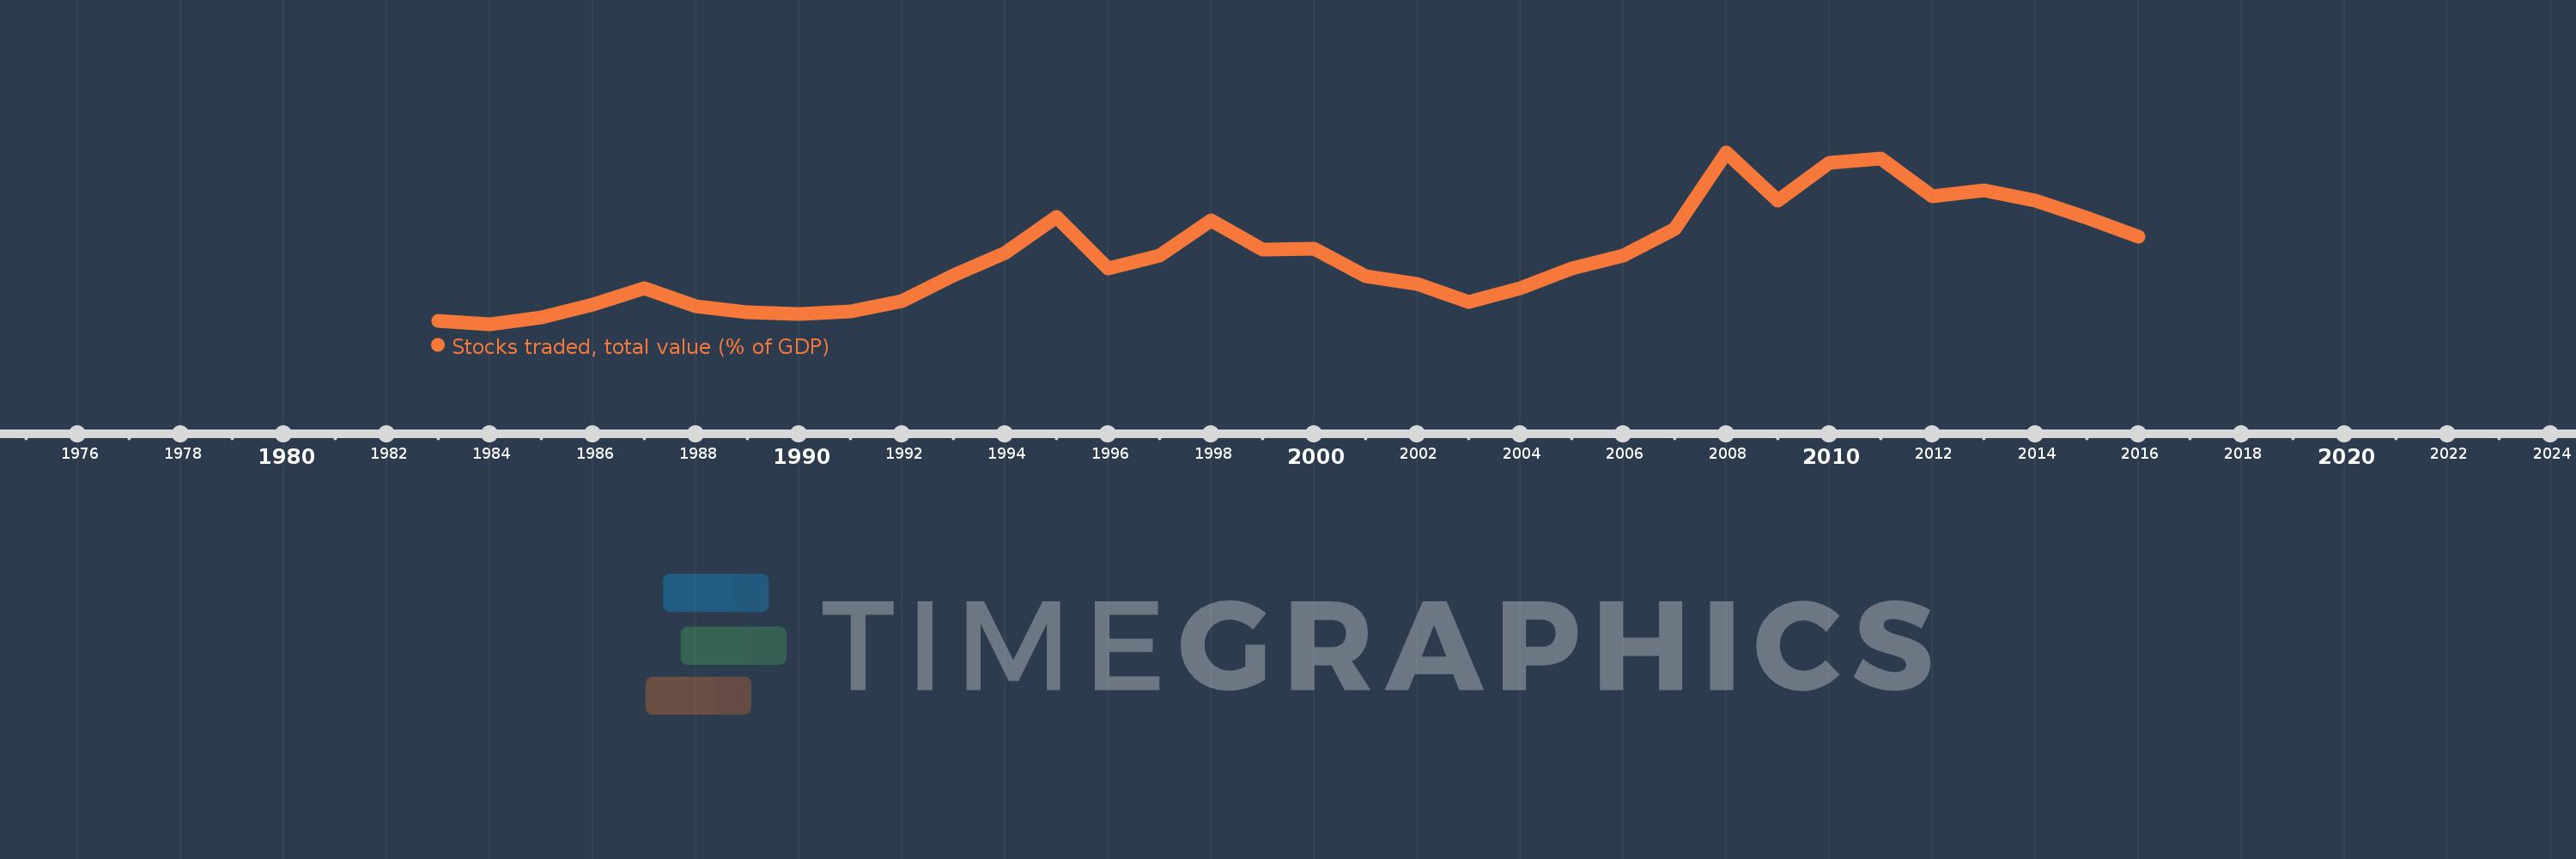
Stocks traded, total value (% of GDP)
2016,2015,2014,2013,2012,2011,2010,2009,2008,2007,2006,2005,2004,2003,2002,2001,2000,1999,1998,1997,1996,1995,1994,1993,1992,1991,1990,1989,1988,1987,1986,1985,1984,1983
Queste statistiche in altri paesi:
Linea del tempo:
Questa scala temporale mostra un grafico dal 1983 anno al 2016 anno. Latin America & Caribbean (excluding high income). I dati fino ad 1982 anno non disponibili. Il numero di osservazioni attuali secondo i date: 34.
La fonte (nome):
Indicatori dello sviluppo mondiale
La fonte (organizzazione):
World Federation of Exchanges database.
Categorie:
Financial Sector
sono stati aggiornati
23 apr 2017 anni
Indicatori delle variazioni dei valori per anni
Minima:
0.928
1 gen 1984 anni
Massimo:
25.707
1 gen 2008 anni
Alla data di osservazione
Valore
Variazione assoluta
La variazione rispetto al valore precedente
1 gen 1983 anni
1.471
+1.471
0.0%
1 gen 1984 anni
0.928
-0.544
-36.96%
1 gen 1985 anni
1.936
+1.009
108.73%
1 gen 1986 anni
3.826
+1.89
97.61%
1 gen 1987 anni
6.131
+2.305
60.24%
1 gen 1988 anni
3.527
-2.604
-42.47%
1 gen 1989 anni
2.672
-0.855
-24.24%
1 gen 1990 anni
2.379
-0.293
-10.95%
1 gen 1991 anni
2.79
+0.411
17.27%
1 gen 1992 anni
4.208
+1.418
50.81%
1 gen 1993 anni
8.039
+3.83
91.02%
1 gen 1994 anni
11.246
+3.207
39.9%
1 gen 1995 anni
16.441
+5.195
46.2%
1 gen 1996 anni
8.994
-7.447
-45.3%
1 gen 1997 anni
10.883
+1.889
21.0%
1 gen 1998 anni
15.912
+5.03
46.22%
1 gen 1999 anni
11.721
-4.192
-26.34%
1 gen 2000 anni
11.84
+0.119
1.02%
1 gen 2001 anni
7.874
-3.966
-33.5%
1 gen 2002 anni
6.684
-1.19
-15.11%
1 gen 2003 anni
4.085
-2.6
-38.89%
1 gen 2004 anni
6.125
+2.04
49.94%
1 gen 2005 anni
9.005
+2.88
47.03%
1 gen 2006 anni
10.793
+1.788
19.86%
1 gen 2007 anni
14.637
+3.844
35.61%
1 gen 2008 anni
25.707
+11.07
75.63%
1 gen 2009 anni
18.791
-6.917
-26.91%
1 gen 2010 anni
24.202
+5.411
28.8%
1 gen 2011 anni
24.804
+0.602
2.49%
1 gen 2012 anni
19.318
-5.486
-22.12%
1 gen 2013 anni
20.197
+0.879
4.55%
1 gen 2014 anni
18.695
-1.502
-7.44%
1 gen 2015 anni
16.298
-2.397
-12.82%
1 gen 2016 anni
13.542
-2.756
-16.91%
Classificazione dei paesi secondo i statistiche attuali per anni


Commenti: