30
/it/
AIzaSyAYiBZKx7MnpbEhh9jyipgxe19OcubqV5w
April 1, 2024
94280
Bulgaria
BGR
true
2
1
Stocks traded, total value (% of GDP)
2014,2013,2012,2011,2010,2009,2008,2007,2006,2005,2004,2003,2002,2001,2000,1999,1998,1997,1996,1995,1994
Download
Biblioteca di statistiche globali →Bulgaria →

Stocks traded, total value (% of GDP)

Queste statistiche in altri paesi:

Arab WorldArgentinaArmeniaAustraliaAustriaBahrainBangladeshBarbadosBelgiumBermudaBoliviaBotswanaBrazilBulgariaCanadaCayman IslandsCentral Europe and the BalticsChannel IslandsChileChinaColombiaCosta RicaCote d'IvoireCroatiaCyprusCzech RepublicDenmarkEarly-demographic dividendEast Asia & PacificEast Asia & Pacific (excluding high income)East Asia & Pacific (IDA & IBRD countries)EcuadorEgypt, Arab Rep.El SalvadorEstoniaEuro areaEurope & Central AsiaEurope & Central Asia (excluding high income)Europe & Central Asia (IDA & IBRD countries)European UnionFijiFinlandFranceGeorgiaGermanyGhanaGreeceGuyanaHigh incomeHong Kong SAR, ChinaHungaryIBRD onlyIcelandIDA & IBRD totalIDA blendIDA totalIndiaIndonesiaIran, Islamic Rep.IrelandIsraelItalyJamaicaJapanJordanKazakhstanKenyaKorea, Rep.KuwaitKyrgyz RepublicLate-demographic dividendLatin America & Caribbean Latin America & Caribbean (excluding high income)Latin America & the Caribbean (IDA & IBRD countries)LatviaLebanonLithuaniaLow & middle incomeLower middle incomeLuxembourgMacedonia, FYRMalawiMalaysiaMaltaMauritiusMexicoMiddle East & North AfricaMiddle East & North Africa (excluding high income)Middle East & North Africa (IDA & IBRD countries)Middle incomeMoldovaMongoliaMontenegroMoroccoNamibiaNetherlandsNew ZealandNigeriaNorth AmericaNorwayOECD membersOmanOther small statesPakistanPanamaPapua New GuineaParaguayPeruPhilippinesPolandPortugalPost-demographic dividendQatarRomaniaRussian FederationSaudi ArabiaSerbiaSeychellesSingaporeSlovak RepublicSloveniaSouth AfricaSouth AsiaSouth Asia (IDA & IBRD)SpainSri LankaSt. Kitts and NevisSub-Saharan Africa Sub-Saharan Africa (excluding high income)Sub-Saharan Africa (IDA & IBRD countries)SwazilandSwedenSwitzerlandTanzaniaThailandTrinidad and TobagoTunisiaTurkeyUgandaUkraineUnited Arab EmiratesUnited KingdomUnited StatesUpper middle incomeUruguayUzbekistanVenezuela, RBVietnamWest Bank and GazaWorldZambiaZimbabwe

Linea del tempo:

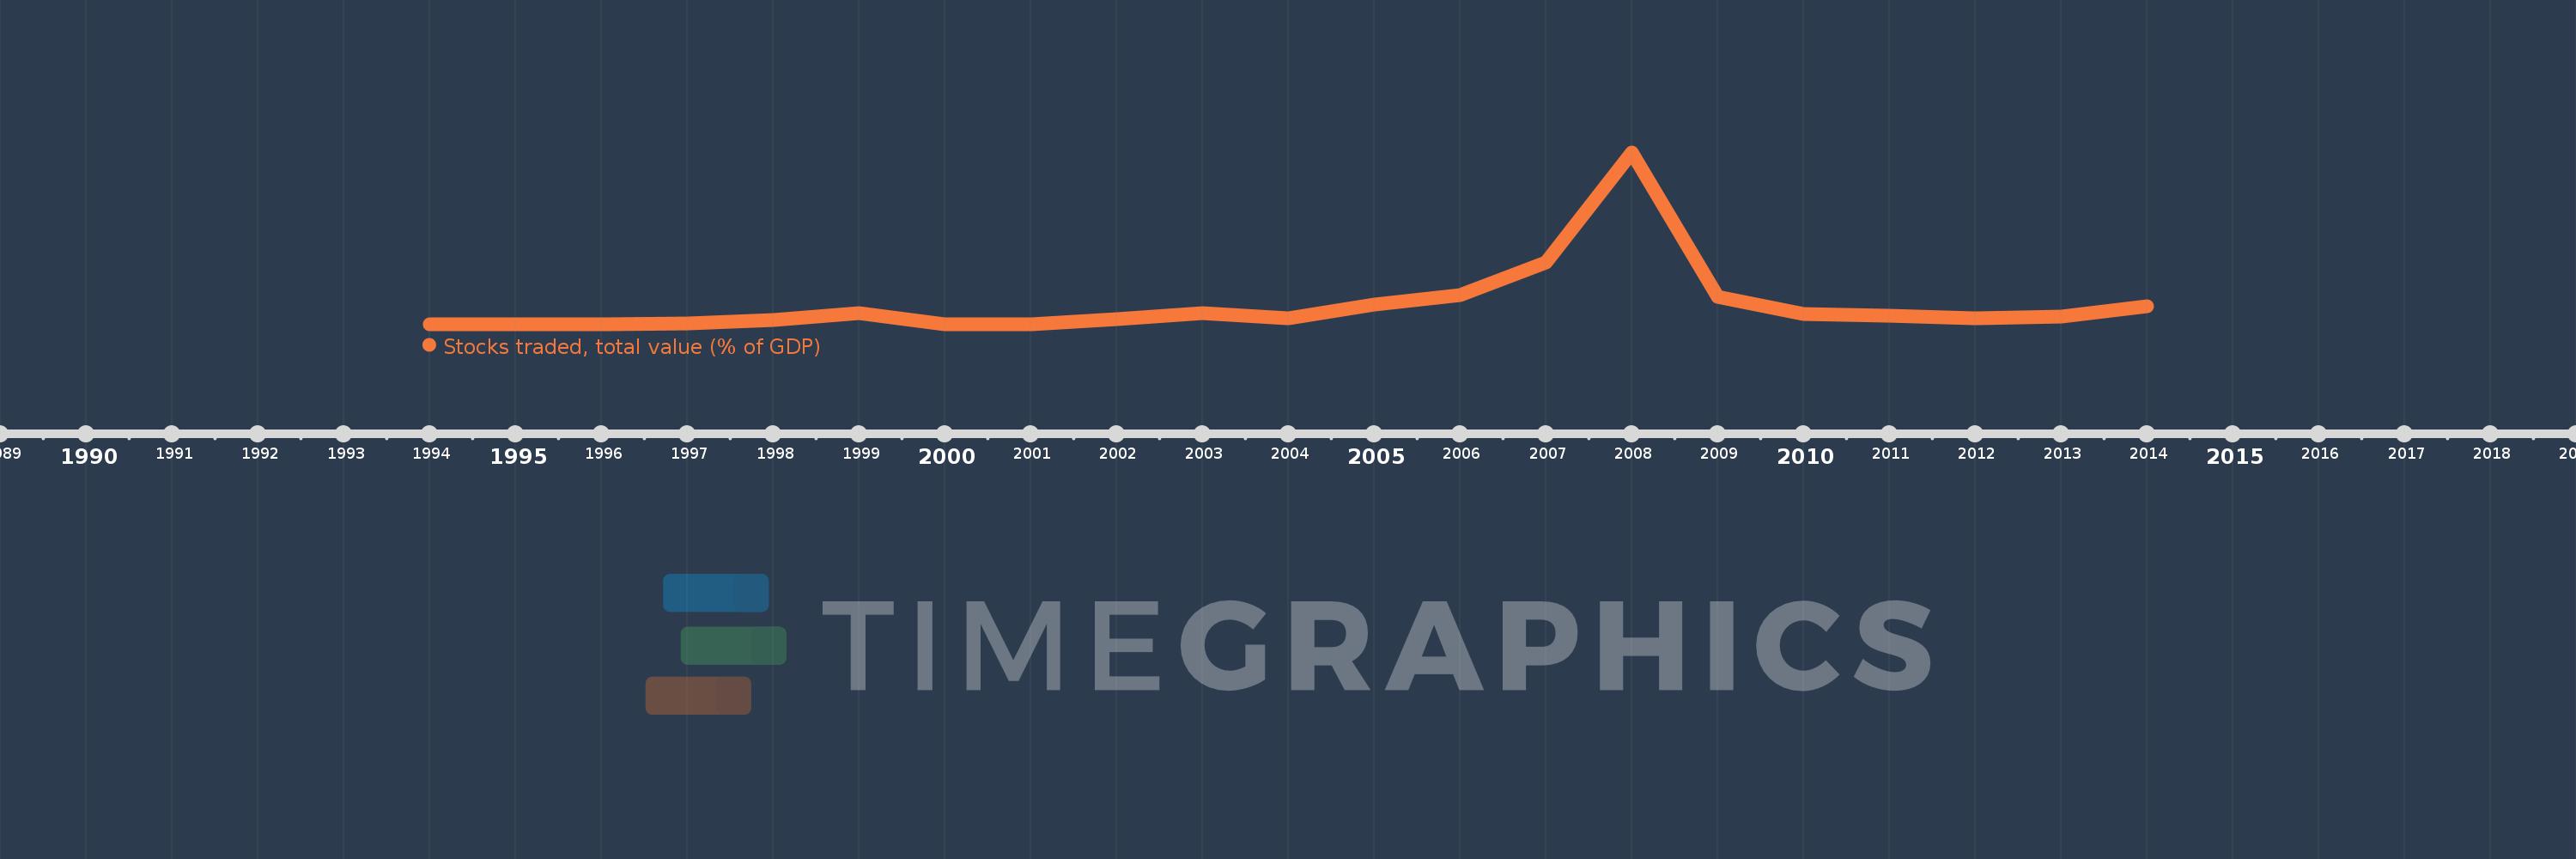
Questa scala temporale mostra un grafico dal 1994 anno al 2014 anno. Bulgaria. I dati fino ad 1993 anno non disponibili. Il numero di osservazioni attuali secondo i date: 21.

La fonte (nome):

Indicatori dello sviluppo mondiale

La fonte (organizzazione):

World Federation of Exchanges database.

Categorie:

Financial Sector

sono stati aggiornati

23 apr 2017 anni

Indicatori delle variazioni dei valori per anni

In media:
1.693
Minima:
0.02
1 gen 1994 anni
Massimo:
15.155
1 gen 2008 anni
Alla data di osservazione
Valore
Variazione assoluta
La variazione rispetto al valore precedente
1 gen 1994 anni
0.02
+0.02
0.0%
1 gen 1995 anni
0.023
+0.002
11.68%
1 gen 1996 anni
0.032
+0.009
41.72%
1 gen 1997 anni
0.096
+0.064
198.13%
1 gen 1998 anni
0.387
+0.291
303.78%
1 gen 1999 anni
0.999
+0.612
158.03%
1 gen 2000 anni
0.043
-0.956
-95.7%
1 gen 2001 anni
0.031
-0.012
-27.27%
1 gen 2002 anni
0.497
+0.466
1.49 Mille.%
1 gen 2003 anni
0.997
+0.5
100.45%
1 gen 2004 anni
0.551
-0.446
-44.69%
1 gen 2005 anni
1.756
+1.204
218.4%
1 gen 2006 anni
2.621
+0.865
49.26%
1 gen 2007 anni
5.446
+2.826
107.83%
1 gen 2008 anni
15.155
+9.709
178.27%
1 gen 2009 anni
2.405
-12.75
-84.13%
1 gen 2010 anni
0.941
-1.465
-60.89%
1 gen 2011 anni
0.745
-0.195
-20.75%
1 gen 2012 anni
0.561
-0.185
-24.8%
1 gen 2013 anni
0.672
+0.111
19.8%
1 gen 2014 anni
1.578
+0.906
134.9%

Classificazione dei paesi secondo i statistiche attuali per anni