29
/es/
es
AIzaSyAYiBZKx7MnpbEhh9jyipgxe19OcubqV5w
April 1, 2024
205860
Namibia
NAM
true
2
1
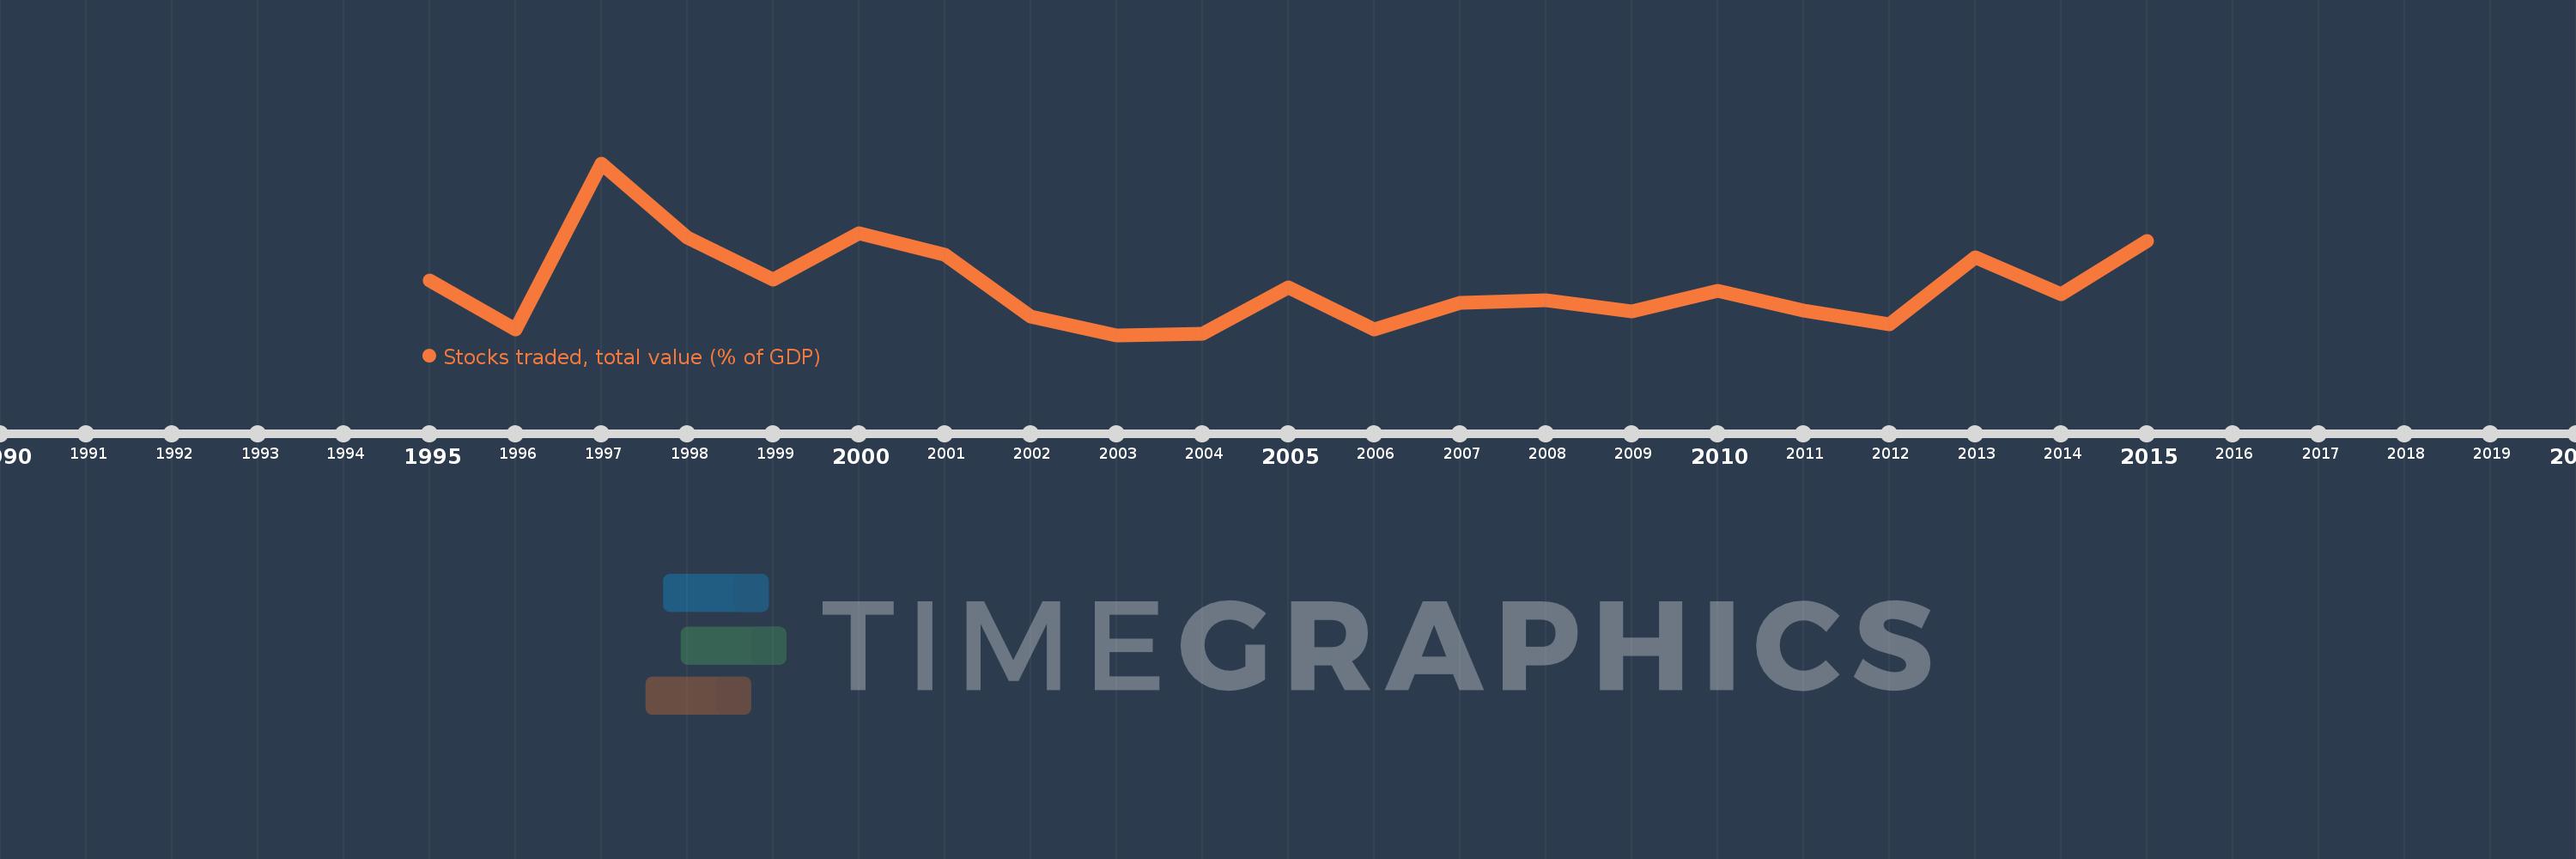
Stocks traded, total value (% of GDP)
2015,2014,2013,2012,2011,2010,2009,2008,2007,2006,2005,2004,2003,2002,2001,2000,1999,1998,1997,1996,1995
Estas estadísticas en otros países:
línea de tiempo (timeline):
En esta escala de tiempo se presenta un gráfico de 1995 y 2015 de Namibia. Los datos de 1994 están ausentes. El número de observaciones reales por fecha: 21.
Fuente (nombre):
Indicadores del desarrollo mundial
Fuente (organización):
World Federation of Exchanges database.
Categorías:
Financial Sector
Se ha actualizado:
23 abr 2017 año
Los indicadores de los cambios de valor en los últimos años
Mínimo:
0.048
1 ene 2003 año
Máximo:
0.956
1 ene 1997 año
A la fecha de observación
Valor
Cambio absoluto
El cambio con respecto al valor anterior
1 ene 1995 año
0.335
+0.335
0.0%
1 ene 1996 año
0.076
-0.26
-77.39%
1 ene 1997 año
0.956
+0.88
1.16 mil%
1 ene 1998 año
0.563
-0.393
-41.09%
1 ene 1999 año
0.339
-0.224
-39.75%
1 ene 2000 año
0.586
+0.247
72.76%
1 ene 2001 año
0.474
-0.112
-19.15%
1 ene 2002 año
0.147
-0.327
-69.06%
1 ene 2003 año
0.048
-0.098
-67.13%
1 ene 2004 año
0.056
+0.007
15.29%
1 ene 2005 año
0.301
+0.245
441.54%
1 ene 2006 año
0.076
-0.225
-74.74%
1 ene 2007 año
0.217
+0.141
185.23%
1 ene 2008 año
0.234
+0.017
8.06%
1 ene 2009 año
0.173
-0.062
-26.32%
1 ene 2010 año
0.282
+0.109
63.1%
1 ene 2011 año
0.179
-0.102
-36.25%
1 ene 2012 año
0.103
-0.077
-42.71%
1 ene 2013 año
0.46
+0.357
347.56%
1 ene 2014 año
0.264
-0.196
-42.57%
1 ene 2015 año
0.543
+0.279
105.52%
Ranking de los países por los datos estadísticos actuales


Comentarios: