30
/es/
AIzaSyAYiBZKx7MnpbEhh9jyipgxe19OcubqV5w
April 1, 2024
114321
Cote d'Ivoire
CIV
true
2
1
Stocks traded, total value (% of GDP)
2016,2015,2014,2013,2012,2011,2010,2009,2008,2007,2006,2005,2004,2003,2002,2001,2000,1999,1997,1996,1995,1994
Download
Estadísticas Globales de la Biblioteca →Cote d'Ivoire →

Stocks traded, total value (% of GDP)

Estas estadísticas en otros países:

Arab WorldArgentinaArmeniaAustraliaAustriaBahrainBangladeshBarbadosBelgiumBermudaBoliviaBotswanaBrazilBulgariaCanadaCayman IslandsCentral Europe and the BalticsChannel IslandsChileChinaColombiaCosta RicaCote d'IvoireCroatiaCyprusCzech RepublicDenmarkEarly-demographic dividendEast Asia & PacificEast Asia & Pacific (excluding high income)East Asia & Pacific (IDA & IBRD countries)EcuadorEgypt, Arab Rep.El SalvadorEstoniaEuro areaEurope & Central AsiaEurope & Central Asia (excluding high income)Europe & Central Asia (IDA & IBRD countries)European UnionFijiFinlandFranceGeorgiaGermanyGhanaGreeceGuyanaHigh incomeHong Kong SAR, ChinaHungaryIBRD onlyIcelandIDA & IBRD totalIDA blendIDA totalIndiaIndonesiaIran, Islamic Rep.IrelandIsraelItalyJamaicaJapanJordanKazakhstanKenyaKorea, Rep.KuwaitKyrgyz RepublicLate-demographic dividendLatin America & Caribbean Latin America & Caribbean (excluding high income)Latin America & the Caribbean (IDA & IBRD countries)LatviaLebanonLithuaniaLow & middle incomeLower middle incomeLuxembourgMacedonia, FYRMalawiMalaysiaMaltaMauritiusMexicoMiddle East & North AfricaMiddle East & North Africa (excluding high income)Middle East & North Africa (IDA & IBRD countries)Middle incomeMoldovaMongoliaMontenegroMoroccoNamibiaNetherlandsNew ZealandNigeriaNorth AmericaNorwayOECD membersOmanOther small statesPakistanPanamaPapua New GuineaParaguayPeruPhilippinesPolandPortugalPost-demographic dividendQatarRomaniaRussian FederationSaudi ArabiaSerbiaSeychellesSingaporeSlovak RepublicSloveniaSouth AfricaSouth AsiaSouth Asia (IDA & IBRD)SpainSri LankaSt. Kitts and NevisSub-Saharan Africa Sub-Saharan Africa (excluding high income)Sub-Saharan Africa (IDA & IBRD countries)SwazilandSwedenSwitzerlandTanzaniaThailandTrinidad and TobagoTunisiaTurkeyUgandaUkraineUnited Arab EmiratesUnited KingdomUnited StatesUpper middle incomeUruguayUzbekistanVenezuela, RBVietnamWest Bank and GazaWorldZambiaZimbabwe

línea de tiempo (timeline):

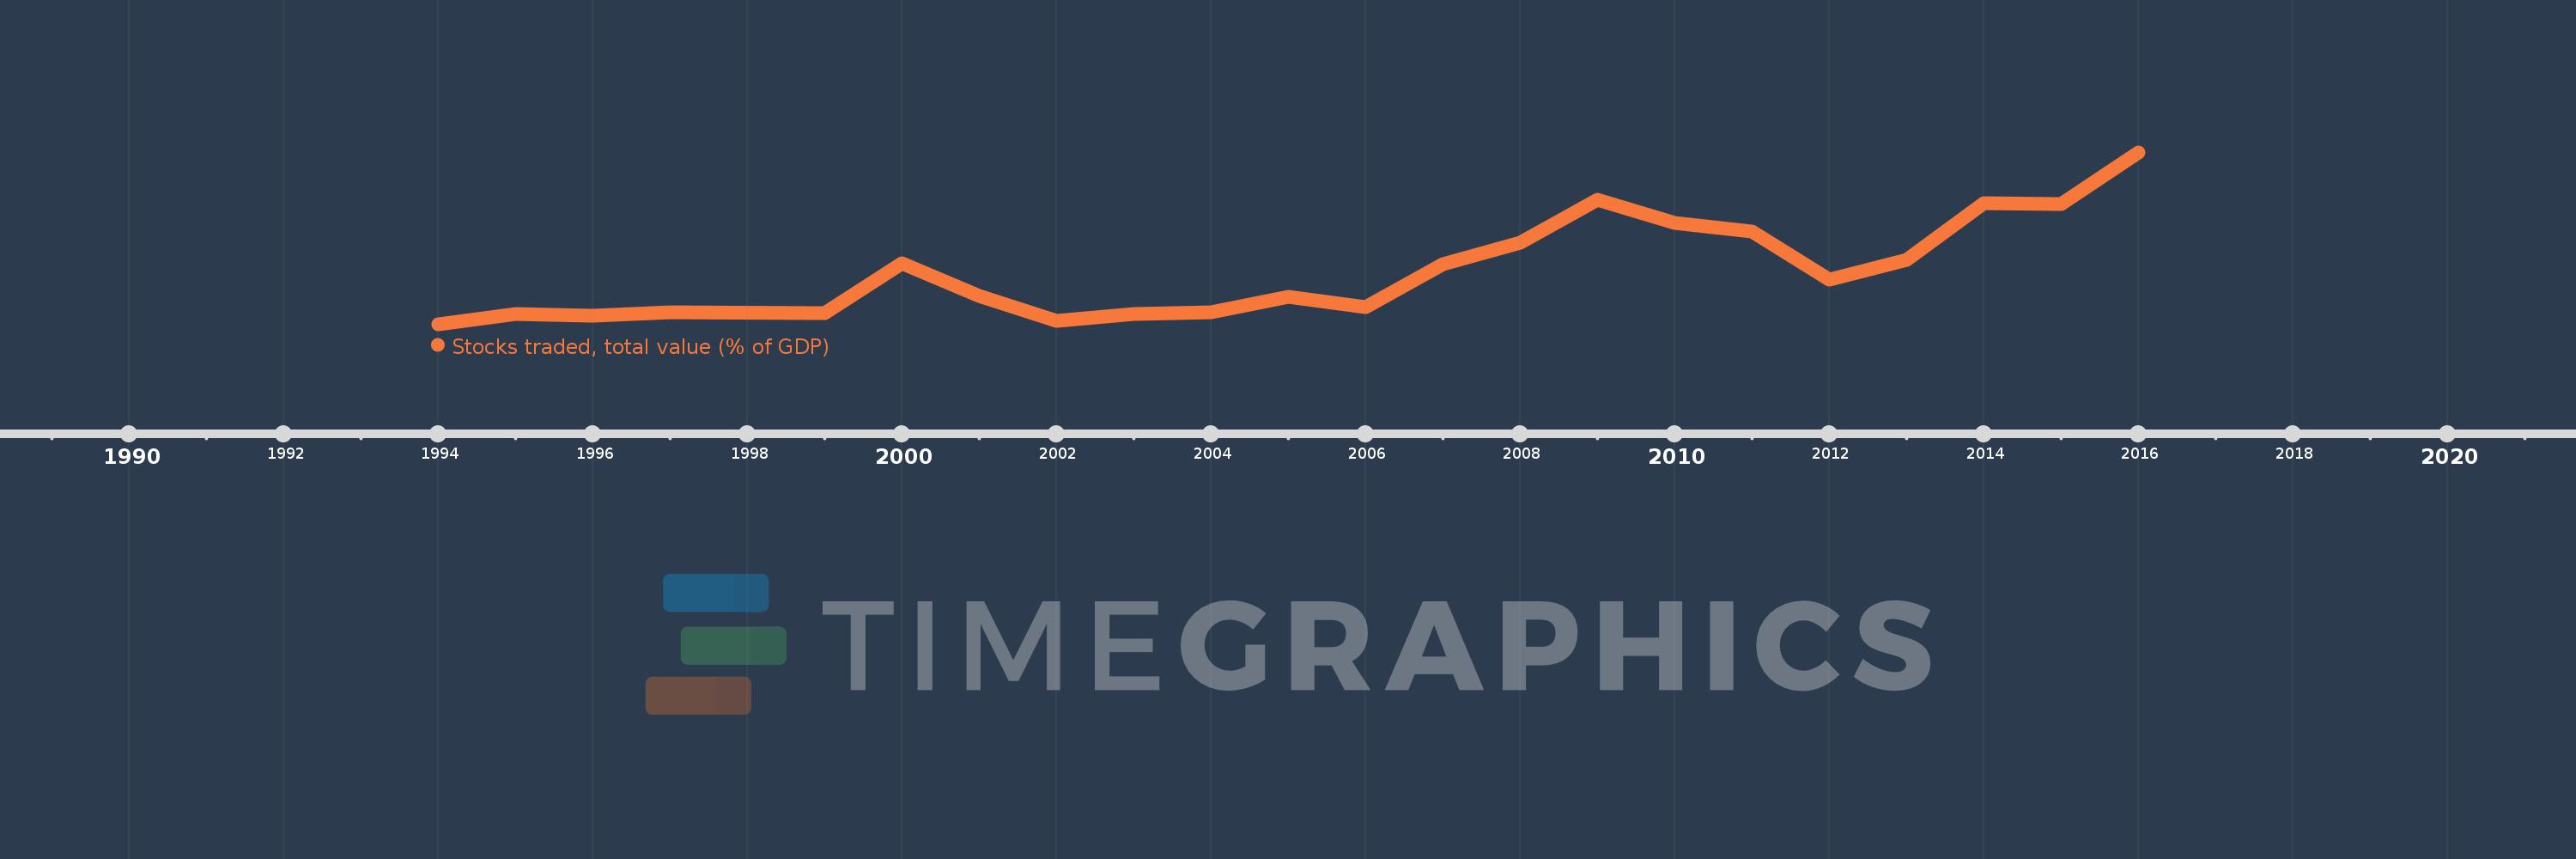
En esta escala de tiempo se presenta un gráfico de 1994 y 2016 de Cote d'Ivoire. Los datos de 1993 están ausentes. El número de observaciones reales por fecha: 22.

Fuente (nombre):

Indicadores del desarrollo mundial

Fuente (organización):

World Federation of Exchanges database.

Categorías:

Financial Sector

Se ha actualizado:

23 abr 2017 año

Los indicadores de los cambios de valor en los últimos años

En promedio:
0.547
Mínimo:
0.047
1 ene 1994 año
Máximo:
1.643
1 ene 2016 año
A la fecha de observación
Valor
Cambio absoluto
El cambio con respecto al valor anterior
1 ene 1994 año
0.047
+0.047
0.0%
1 ene 1995 año
0.138
+0.091
193.83%
1 ene 1996 año
0.128
-0.01
-7.34%
1 ene 1997 año
0.156
+0.028
21.91%
1 ene 1999 año
0.151
-0.005
-3.5%
1 ene 2000 año
0.609
+0.459
304.07%
1 ene 2001 año
0.308
-0.302
-49.48%
1 ene 2002 año
0.077
-0.231
-75.04%
1 ene 2003 año
0.142
+0.065
84.36%
1 ene 2004 año
0.159
+0.017
12.12%
1 ene 2005 año
0.303
+0.144
90.82%
1 ene 2006 año
0.205
-0.098
-32.48%
1 ene 2007 año
0.601
+0.397
193.86%
1 ene 2008 año
0.808
+0.207
34.36%
1 ene 2009 año
1.205
+0.397
49.12%
1 ene 2010 año
0.991
-0.214
-17.74%
1 ene 2011 año
0.912
-0.079
-7.95%
1 ene 2012 año
0.459
-0.453
-49.65%
1 ene 2013 año
0.644
+0.185
40.26%
1 ene 2014 año
1.175
+0.531
82.4%
1 ene 2015 año
1.166
-0.009
-0.77%
1 ene 2016 año
1.643
+0.477
40.92%

Ranking de los países por los datos estadísticos actuales