29
/es/
es
AIzaSyAYiBZKx7MnpbEhh9jyipgxe19OcubqV5w
April 1, 2024
26149
Central Europe and the Baltics
CEB
false
2
1
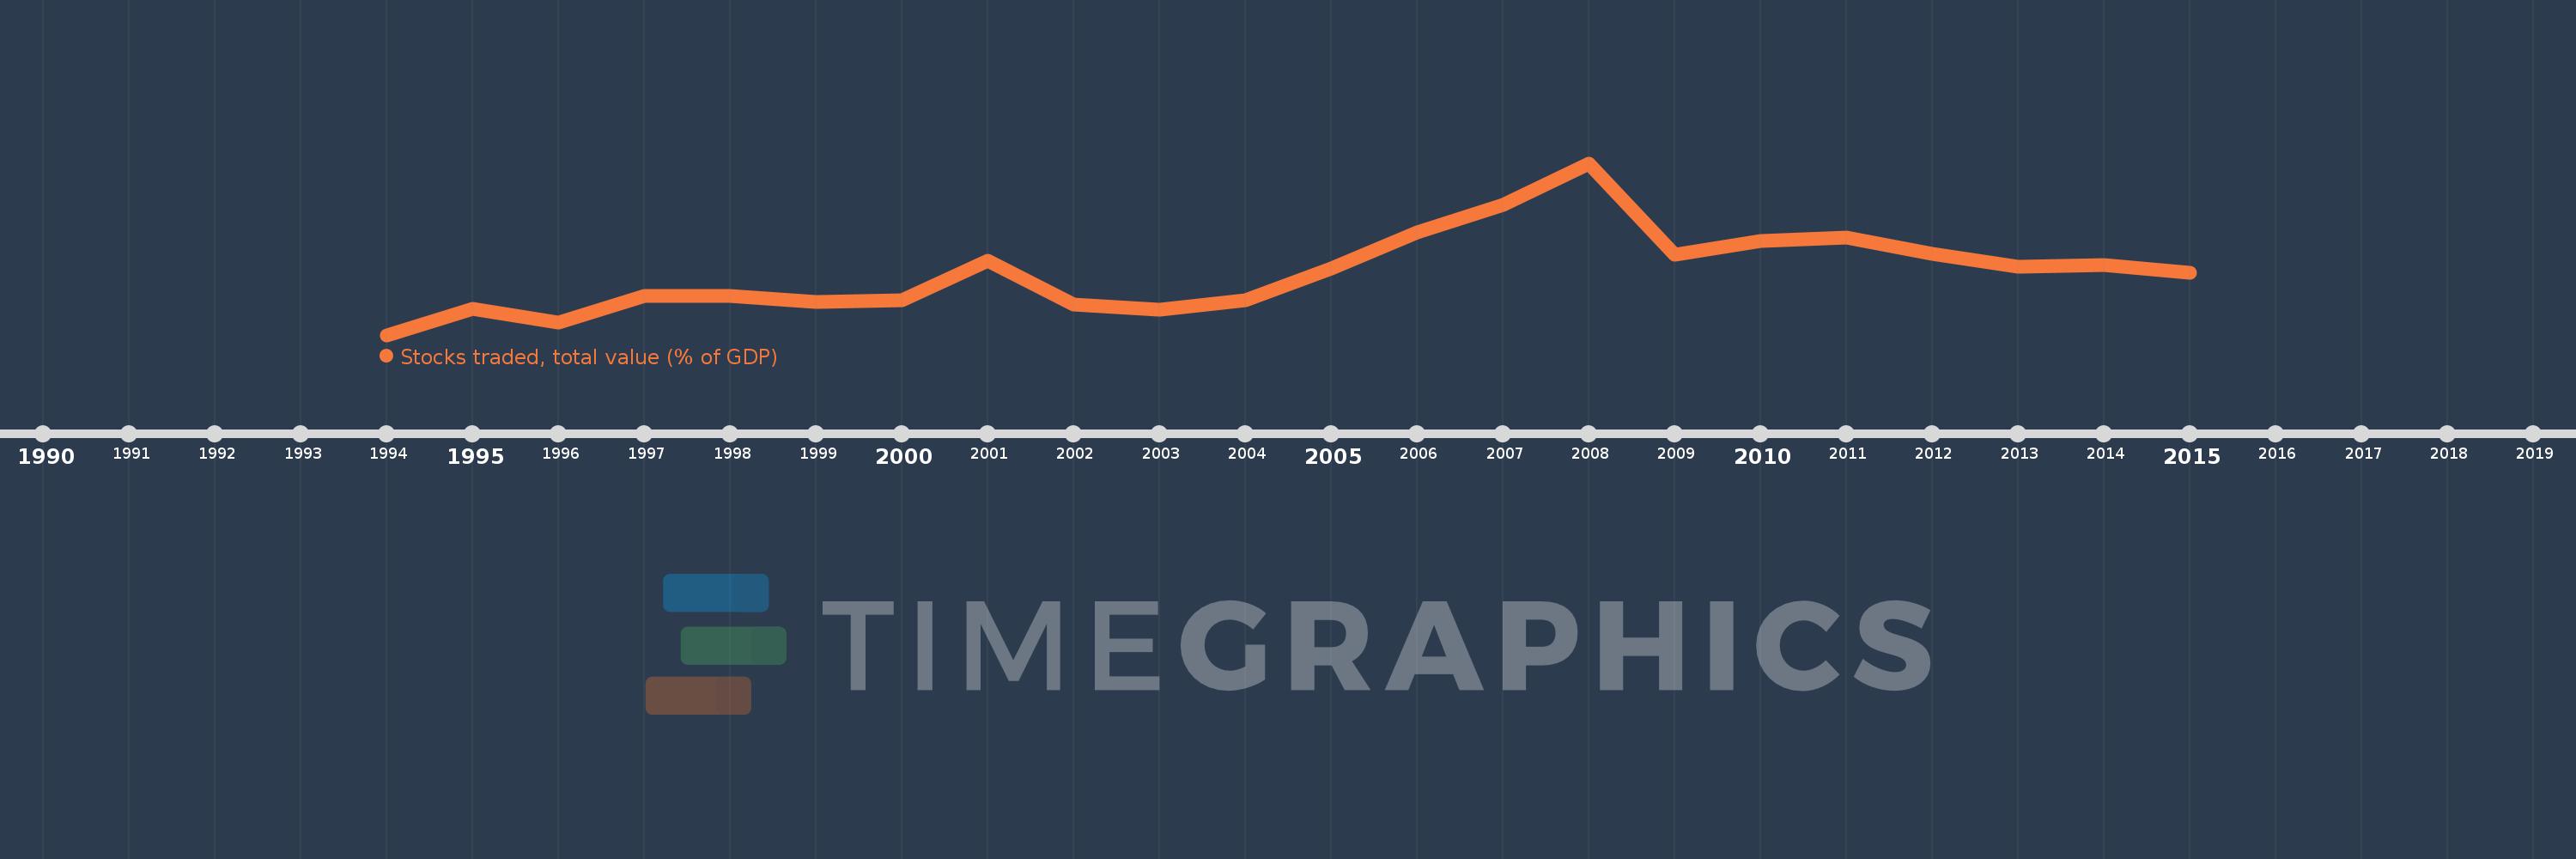
Stocks traded, total value (% of GDP)
2015,2014,2013,2012,2011,2010,2009,2008,2007,2006,2005,2004,2003,2002,2001,2000,1999,1998,1997,1996,1995,1994
Estas estadísticas en otros países:
línea de tiempo (timeline):
En esta escala de tiempo se presenta un gráfico de 1994 y 2015 de Central Europe and the Baltics. Los datos de 1993 están ausentes. El número de observaciones reales por fecha: 22.
Fuente (nombre):
Indicadores del desarrollo mundial
Fuente (organización):
World Federation of Exchanges database.
Categorías:
Financial Sector
Se ha actualizado:
23 abr 2017 año
Los indicadores de los cambios de valor en los últimos años
Mínimo:
1.354
1 ene 1994 año
Máximo:
16.452
1 ene 2008 año
A la fecha de observación
Valor
Cambio absoluto
El cambio con respecto al valor anterior
1 ene 1994 año
1.354
+1.354
0.0%
1 ene 1995 año
3.677
+2.323
171.58%
1 ene 1996 año
2.418
-1.26
-34.25%
1 ene 1997 año
4.806
+2.388
98.78%
1 ene 1998 año
4.8
-0.006
-0.12%
1 ene 1999 año
4.282
-0.518
-10.79%
1 ene 2000 año
4.415
+0.133
3.1%
1 ene 2001 año
7.9
+3.486
78.96%
1 ene 2002 año
4.042
-3.859
-48.84%
1 ene 2003 año
3.607
-0.435
-10.76%
1 ene 2004 año
4.446
+0.839
23.27%
1 ene 2005 año
7.202
+2.755
61.97%
1 ene 2006 año
10.408
+3.206
44.52%
1 ene 2007 año
12.804
+2.396
23.03%
1 ene 2008 año
16.452
+3.647
28.49%
1 ene 2009 año
8.383
-8.069
-49.05%
1 ene 2010 año
9.634
+1.251
14.92%
1 ene 2011 año
9.89
+0.256
2.66%
1 ene 2012 año
8.471
-1.419
-14.35%
1 ene 2013 año
7.337
-1.134
-13.39%
1 ene 2014 año
7.483
+0.146
2.0%
1 ene 2015 año
6.838
-0.645
-8.62%
Ranking de los países por los datos estadísticos actuales


Comentarios: