29
/es/
es
AIzaSyAYiBZKx7MnpbEhh9jyipgxe19OcubqV5w
April 1, 2024
117435
Cyprus
CYP
true
2
1
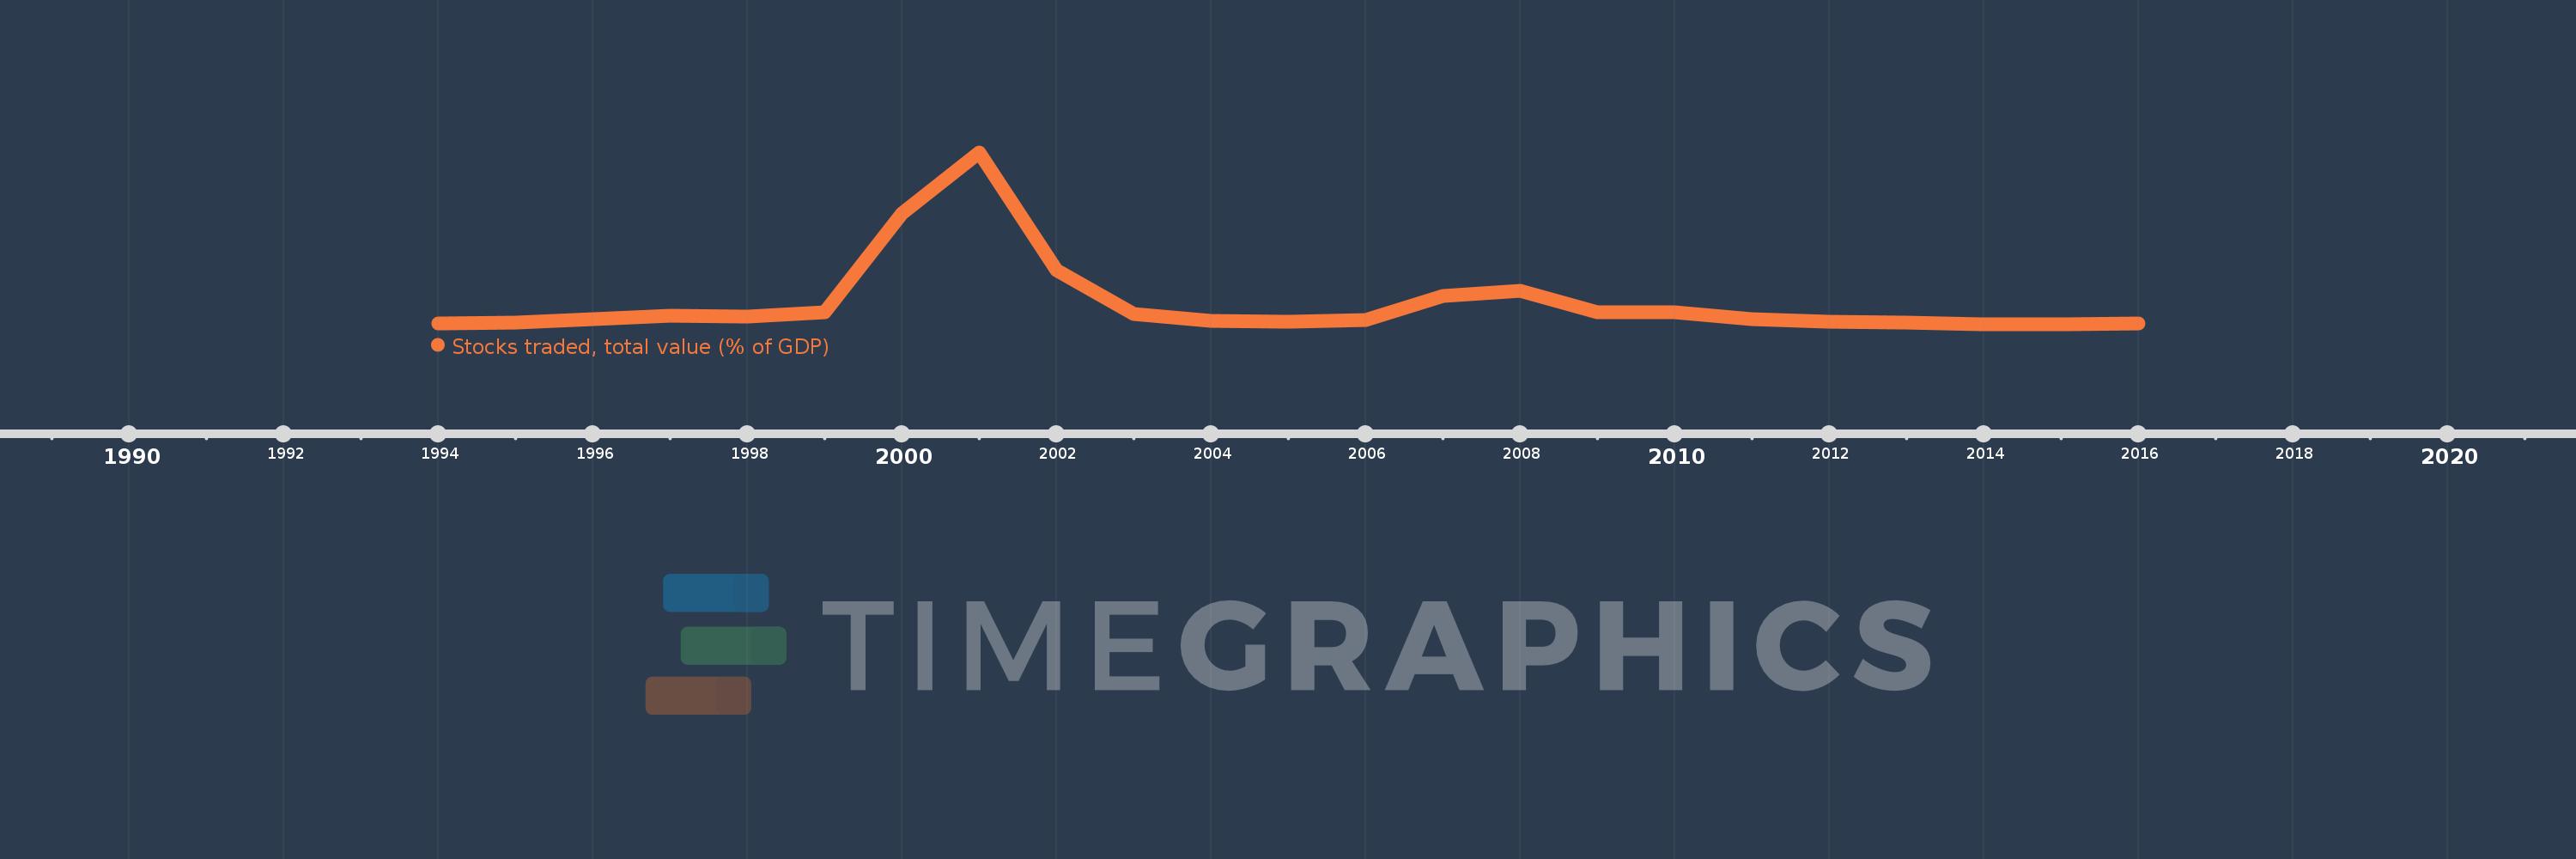
Stocks traded, total value (% of GDP)
2016,2015,2014,2013,2012,2011,2010,2009,2008,2007,2006,2005,2004,2003,2002,2001,2000,1999,1998,1997,1996,1995,1994
Estas estadísticas en otros países:
línea de tiempo (timeline):
En esta escala de tiempo se presenta un gráfico de 1994 y 2016 de Cyprus. Los datos de 1993 están ausentes. El número de observaciones reales por fecha: 23.
Fuente (nombre):
Indicadores del desarrollo mundial
Fuente (organización):
World Federation of Exchanges database.
Categorías:
Financial Sector
Se ha actualizado:
23 abr 2017 año
Los indicadores de los cambios de valor en los últimos años
Mínimo:
0.171
1 ene 2014 año
Máximo:
93.695
1 ene 2001 año
A la fecha de observación
Valor
Cambio absoluto
El cambio con respecto al valor anterior
1 ene 1994 año
0.426
+0.426
0.0%
1 ene 1995 año
1.188
+0.761
178.57%
1 ene 1996 año
3.019
+1.832
154.2%
1 ene 1997 año
4.631
+1.612
53.4%
1 ene 1998 año
4.195
-0.436
-9.42%
1 ene 1999 año
6.764
+2.569
61.23%
1 ene 2000 año
60.38
+53.616
792.68%
1 ene 2001 año
93.695
+33.315
55.18%
1 ene 2002 año
29.798
-63.898
-68.2%
1 ene 2003 año
5.75
-24.048
-80.7%
1 ene 2004 año
2.129
-3.621
-62.98%
1 ene 2005 año
1.519
-0.609
-28.63%
1 ene 2006 año
2.528
+1.009
66.39%
1 ene 2007 año
15.421
+12.893
510.04%
1 ene 2008 año
18.543
+3.122
20.24%
1 ene 2009 año
6.446
-12.098
-65.24%
1 ene 2010 año
6.789
+0.344
5.33%
1 ene 2011 año
2.905
-3.884
-57.22%
1 ene 2012 año
1.638
-1.267
-43.62%
1 ene 2013 año
1.178
-0.46
-28.08%
1 ene 2014 año
0.171
-1.007
-85.45%
1 ene 2015 año
0.243
+0.072
41.74%
1 ene 2016 año
0.669
+0.426
175.54%
Ranking de los países por los datos estadísticos actuales


Comentarios: