29
/es/
es
AIzaSyAYiBZKx7MnpbEhh9jyipgxe19OcubqV5w
April 1, 2024
33080
Europe & Central Asia (IDA & IBRD countries)
TEC
false
2
1
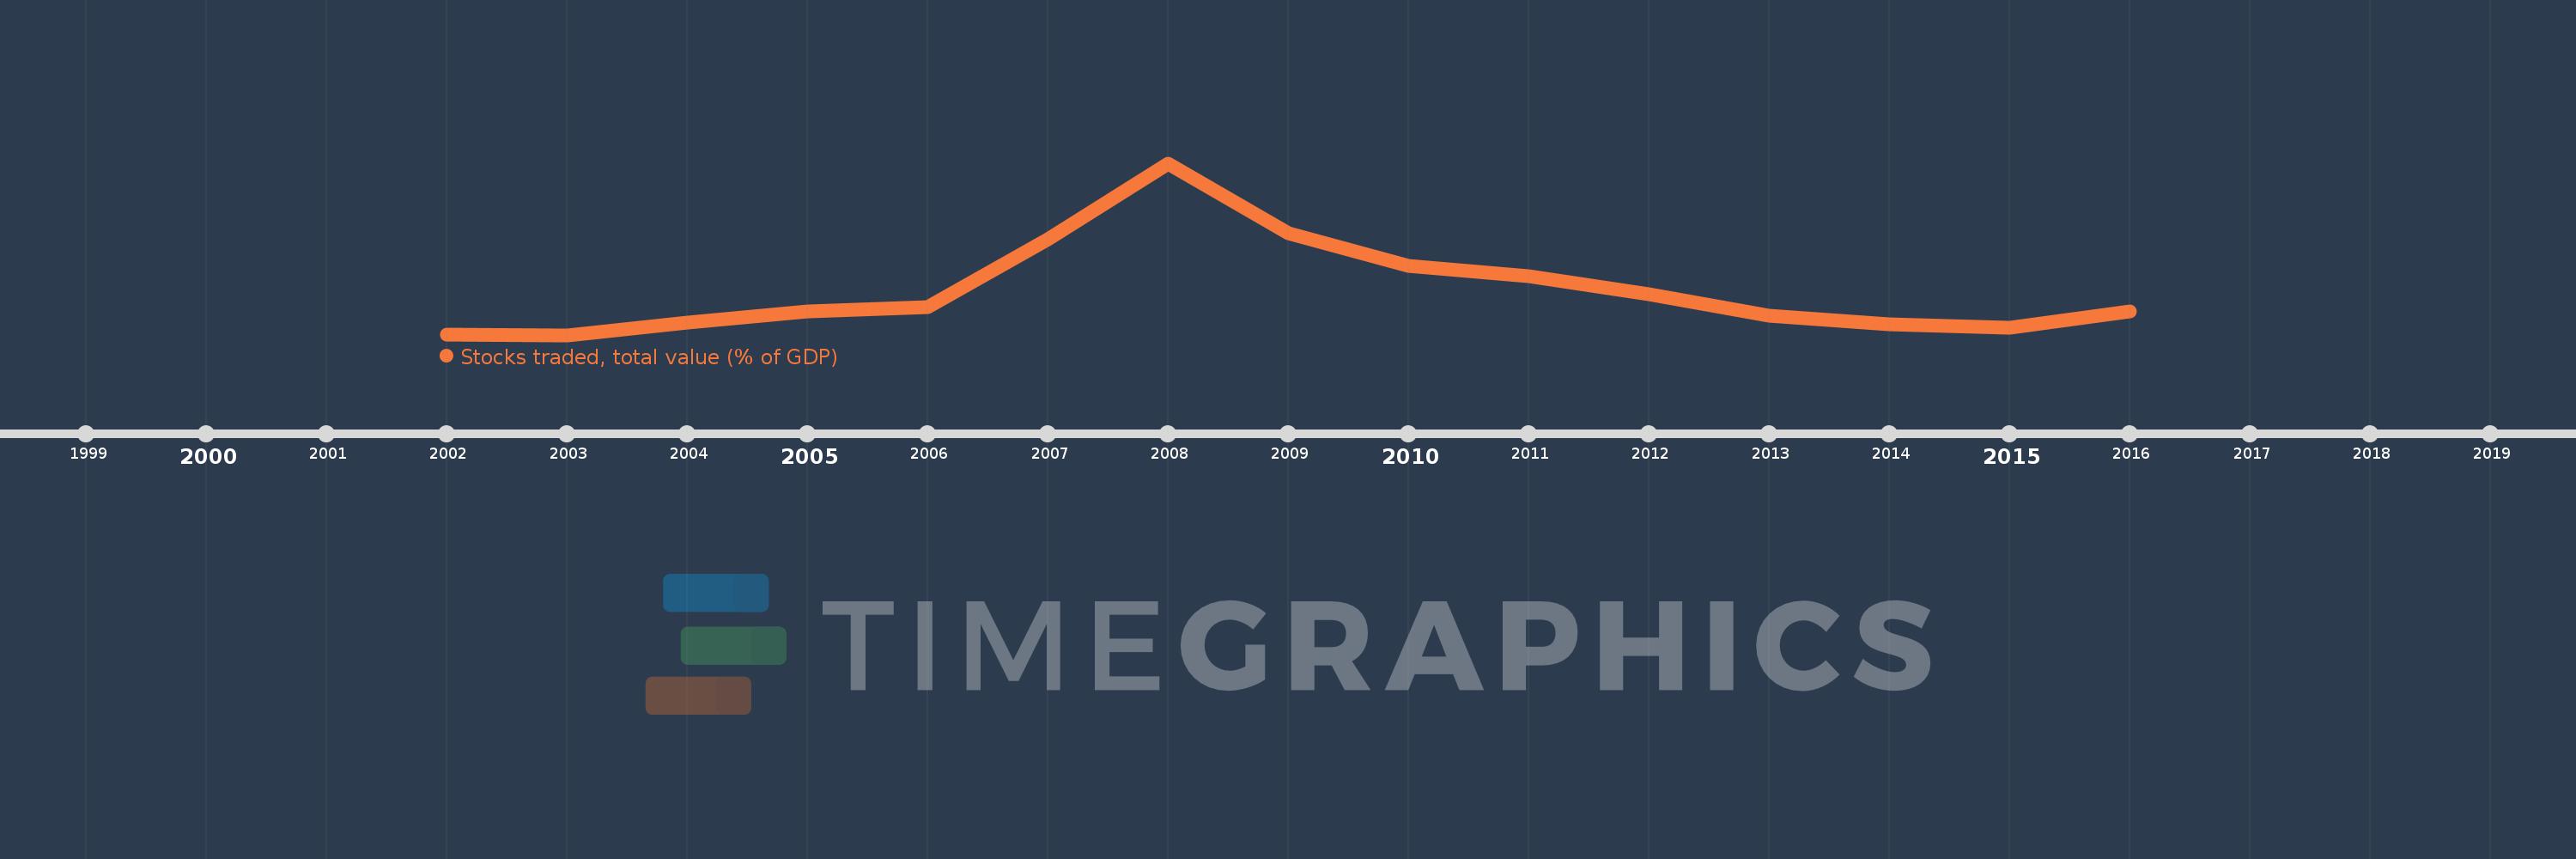
Stocks traded, total value (% of GDP)
2016,2015,2014,2013,2012,2011,2010,2009,2008,2007,2006,2005,2004,2003,2002
Estas estadísticas en otros países:
línea de tiempo (timeline):
En esta escala de tiempo se presenta un gráfico de 2002 y 2016 de Europe & Central Asia (IDA & IBRD countries). Los datos de 2001 están ausentes. El número de observaciones reales por fecha: 15.
Fuente (nombre):
Indicadores del desarrollo mundial
Fuente (organización):
World Federation of Exchanges database.
Categorías:
Financial Sector
Se ha actualizado:
23 abr 2017 año
Los indicadores de los cambios de valor en los últimos años
Mínimo:
12.87
1 ene 2003 año
Máximo:
60.125
1 ene 2008 año
A la fecha de observación
Valor
Cambio absoluto
El cambio con respecto al valor anterior
1 ene 2002 año
12.955
+12.955
0.0%
1 ene 2003 año
12.87
-0.085
-0.66%
1 ene 2004 año
16.367
+3.497
27.18%
1 ene 2005 año
19.336
+2.97
18.14%
1 ene 2006 año
20.486
+1.15
5.94%
1 ene 2007 año
39.111
+18.625
90.91%
1 ene 2008 año
60.125
+21.014
53.73%
1 ene 2009 año
40.88
-19.245
-32.01%
1 ene 2010 año
31.85
-9.03
-22.09%
1 ene 2011 año
28.958
-2.892
-9.08%
1 ene 2012 año
24.05
-4.908
-16.95%
1 ene 2013 año
18.215
-5.835
-24.26%
1 ene 2014 año
15.936
-2.28
-12.52%
1 ene 2015 año
14.934
-1.001
-6.28%
1 ene 2016 año
19.269
+4.334
29.02%
Ranking de los países por los datos estadísticos actuales


Comentarios: