29
/fr/
fr
AIzaSyAYiBZKx7MnpbEhh9jyipgxe19OcubqV5w
April 1, 2024
99916
Cameroon
CMR
true
2
1
GDP (constant 2010 US$)
2016,2015,2014,2013,2012,2011,2010,2009,2008,2007,2006,2005,2004,2003,2002,2001,2000,1999,1998,1997,1996,1995,1994,1993,1992,1991,1990,1989,1988,1987,1986,1985,1984,1983,1982,1981,1980,1979,1978,1977,1976,1975,1974,1973,1972,1971,1970,1969,1968,1967,1966,1965,1964,1963,1962,1961
Cette statistique dans les autres pays:
AfghanistanAlbaniaAlgeriaAndorraAngolaAntigua and BarbudaArab WorldArgentinaArmeniaArubaAustraliaAustriaAzerbaijanBahamas, TheBahrainBangladeshBarbadosBelarusBelgiumBelizeBeninBermudaBhutanBoliviaBosnia and HerzegovinaBotswanaBrazilBrunei DarussalamBulgariaBurkina FasoBurundiCabo VerdeCambodiaCameroonCanadaCaribbean small statesCentral African RepublicCentral Europe and the BalticsChadChileChinaColombiaComorosCongo, Dem. Rep.Congo, Rep.Costa RicaCote d'IvoireCroatiaCubaCyprusCzech RepublicDenmarkDjiboutiDominicaDominican RepublicEarly-demographic dividendEast Asia & PacificEast Asia & Pacific (excluding high income)East Asia & Pacific (IDA & IBRD countries)EcuadorEgypt, Arab Rep.El SalvadorEquatorial GuineaEritreaEstoniaEthiopiaEuro areaEurope & Central AsiaEurope & Central Asia (excluding high income)Europe & Central Asia (IDA & IBRD countries)European UnionFaroe IslandsFijiFinlandFragile and conflict affected situationsFranceGabonGambia, TheGeorgiaGermanyGhanaGreeceGreenlandGrenadaGuatemalaGuineaGuinea-BissauGuyanaHaitiHeavily indebted poor countries (HIPC)High incomeHondurasHong Kong SAR, ChinaHungaryIBRD onlyIcelandIDA & IBRD totalIDA blendIDA onlyIDA totalIndiaIndonesiaIran, Islamic Rep.IraqIrelandIsle of ManIsraelItalyJamaicaJapanJordanKazakhstanKenyaKiribatiKorea, Rep.KosovoKuwaitKyrgyz RepublicLao PDRLate-demographic dividendLatin America & Caribbean Latin America & Caribbean (excluding high income)Latin America & the Caribbean (IDA & IBRD countries)LatviaLeast developed countries: UN classificationLebanonLesothoLiberiaLibyaLiechtensteinLithuaniaLow & middle incomeLow incomeLower middle incomeLuxembourgMacao SAR, ChinaMacedonia, FYRMadagascarMalawiMalaysiaMaldivesMaliMaltaMarshall IslandsMauritaniaMauritiusMexicoMicronesia, Fed. Sts.Middle East & North AfricaMiddle East & North Africa (excluding high income)Middle East & North Africa (IDA & IBRD countries)Middle incomeMoldovaMonacoMongoliaMontenegroMoroccoMozambiqueMyanmarNamibiaNauruNepalNetherlandsNew ZealandNicaraguaNigerNigeriaNorth AmericaNorwayOECD membersOmanOther small statesPacific island small statesPakistanPalauPanamaPapua New GuineaParaguayPeruPhilippinesPolandPortugalPost-demographic dividendPre-demographic dividendPuerto RicoQatarRomaniaRussian FederationRwandaSamoaSao Tome and PrincipeSaudi ArabiaSenegalSerbiaSeychellesSierra LeoneSingaporeSlovak RepublicSloveniaSmall statesSolomon IslandsSouth AfricaSouth AsiaSouth Asia (IDA & IBRD)South SudanSpainSri LankaSt. Kitts and NevisSt. LuciaSt. Vincent and the GrenadinesSub-Saharan Africa Sub-Saharan Africa (excluding high income)Sub-Saharan Africa (IDA & IBRD countries)SudanSurinameSwazilandSwedenSwitzerlandTajikistanTanzaniaThailandTimor-LesteTogoTongaTrinidad and TobagoTunisiaTurkeyTurkmenistanTuvaluUgandaUkraineUnited Arab EmiratesUnited KingdomUnited StatesUpper middle incomeUruguayUzbekistanVanuatuVenezuela, RBVietnamWest Bank and GazaWorldYemen, Rep.ZambiaZimbabwe La ligne de temps
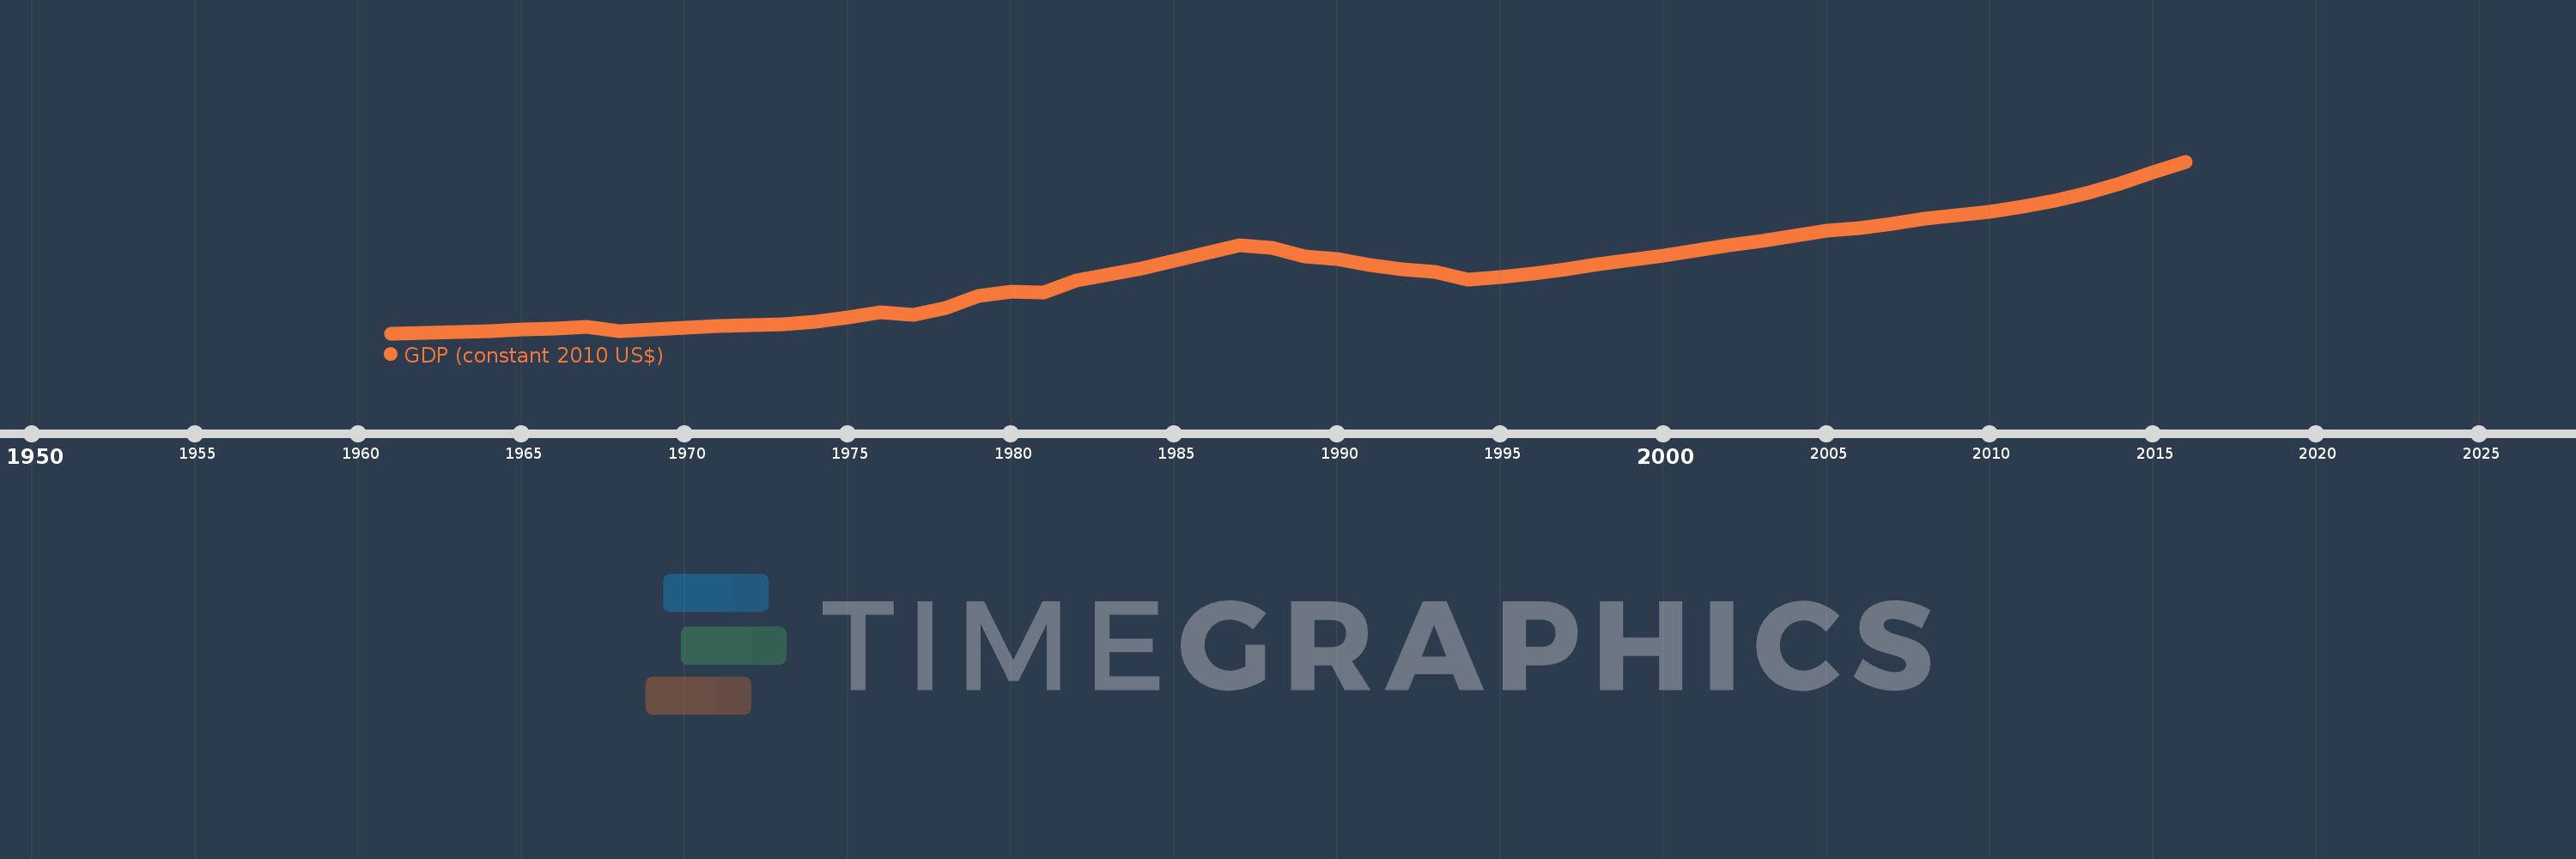
Cette échelle de temps montre un graphique de 1961 année à 2016 année Cameroon. Les données jusqu'à 1960 année ne sont pas présentés. Quantité d'observations actuelles selon dates: 56.
Source (désignation):
Les indicateurs du développement mondiale
Source (organisation):
World Bank national accounts data, and OECD National Accounts data files.
Catégories:
Economy & Growth
Dernière mise à jour
23 avr. 2017
Les indicateurs de changement de valeurs selon les années
Minimum:
4.662 mds
1 janv. 1961
Maximum:
30.431 mds
1 janv. 2016
Pour la date d''observation
Valeur
Changement absolu
Le changement par rapport à la valeur précédente
1 janv. 1961
4.662 mds
+4.662 mds
0.0%
1 janv. 1962
4.717 mds
+55.179 mln.
1.18%
1 janv. 1963
4.86 mds
+143.464 mln.
3.04%
1 janv. 1964
5.042 mds
+181.897 mln.
3.74%
1 janv. 1965
5.221 mds
+178.853 mln.
3.55%
1 janv. 1966
5.327 mds
+105.78 mln.
2.03%
1 janv. 1967
5.573 mds
+245.829 mln.
4.61%
1 janv. 1968
4.965 mds
-608.087 mln.
-10.91%
1 janv. 1969
5.28 mds
+315.065 mln.
6.35%
1 janv. 1970
5.538 mds
+258.778 mln.
4.9%
1 janv. 1971
5.71 mds
+171.25 mln.
3.09%
1 janv. 1972
5.908 mds
+198.678 mln.
3.48%
1 janv. 1973
6.066 mds
+157.978 mln.
2.67%
1 janv. 1974
6.391 mds
+324.89 mln.
5.36%
1 janv. 1975
7.077 mds
+686.044 mln.
10.73%
1 janv. 1976
7.873 mds
+795.836 mln.
11.25%
1 janv. 1977
7.44 mds
-432.635 mln.
-5.5%
1 janv. 1978
8.463 mds
+1.022 mds
13.74%
1 janv. 1979
10.325 mds
+1.862 mds
22.0%
1 janv. 1980
10.948 mds
+623.112 mln.
6.04%
1 janv. 1981
10.733 mds
-215.158 mln.
-1.97%
1 janv. 1982
12.566 mds
+1.833 mds
17.08%
1 janv. 1983
13.511 mds
+944.497 mln.
7.52%
1 janv. 1984
14.438 mds
+927.753 mln.
6.87%
1 janv. 1985
15.518 mds
+1.079 mds
7.47%
1 janv. 1986
16.769 mds
+1.251 mds
8.06%
1 janv. 1987
17.904 mds
+1.136 mds
6.77%
1 janv. 1988
17.52 mds
-384.344 mln.
-2.15%
1 janv. 1989
16.149 mds
-1.371 mds
-7.82%
1 janv. 1990
15.856 mds
-293.775 mln.
-1.82%
1 janv. 1991
14.887 mds
-968.09 mln.
-6.11%
1 janv. 1992
14.32 mds
-567.003 mln.
-3.81%
1 janv. 1993
13.876 mds
-443.934 mln.
-3.1%
1 janv. 1994
12.776 mds
-1.101 mds
-7.93%
1 janv. 1995
13.039 mds
+263.616 mln.
2.06%
1 janv. 1996
13.578 mds
+538.316 mln.
4.13%
1 janv. 1997
14.245 mds
+666.93 mln.
4.91%
1 janv. 1998
15.002 mds
+756.984 mln.
5.31%
1 janv. 1999
15.736 mds
+734.385 mln.
4.9%
1 janv. 2000
16.375 mds
+639.242 mln.
4.06%
1 janv. 2001
17.059 mds
+683.436 mln.
4.17%
1 janv. 2002
17.829 mds
+770.077 mln.
4.51%
1 janv. 2003
18.544 mds
+714.764 mln.
4.01%
1 janv. 2004
19.291 mds
+747.489 mln.
4.03%
1 janv. 2005
20.005 mds
+714.126 mln.
3.7%
1 janv. 2006
20.465 mds
+459.489 mln.
2.3%
1 janv. 2007
21.124 mds
+659.781 mln.
3.22%
1 janv. 2008
21.812 mds
+687.741 mln.
3.26%
1 janv. 2009
22.441 mds
+629.073 mln.
2.88%
1 janv. 2010
22.875 mds
+433.532 mln.
1.93%
1 janv. 2011
23.622 mds
+747.696 mln.
3.27%
1 janv. 2012
24.601 mds
+978.111 mln.
4.14%
1 janv. 2013
25.729 mds
+1.129 mds
4.59%
1 janv. 2014
27.16 mds
+1.431 mds
5.56%
1 janv. 2015
28.77 mds
+1.61 mds
5.93%
1 janv. 2016
30.431 mds
+1.661 mds
5.77%
Classement des pays selon les statistiques actuelles par années


Commentaires: