29
/fr/
fr
AIzaSyAYiBZKx7MnpbEhh9jyipgxe19OcubqV5w
April 1, 2024
235765
Senegal
SEN
true
2
1
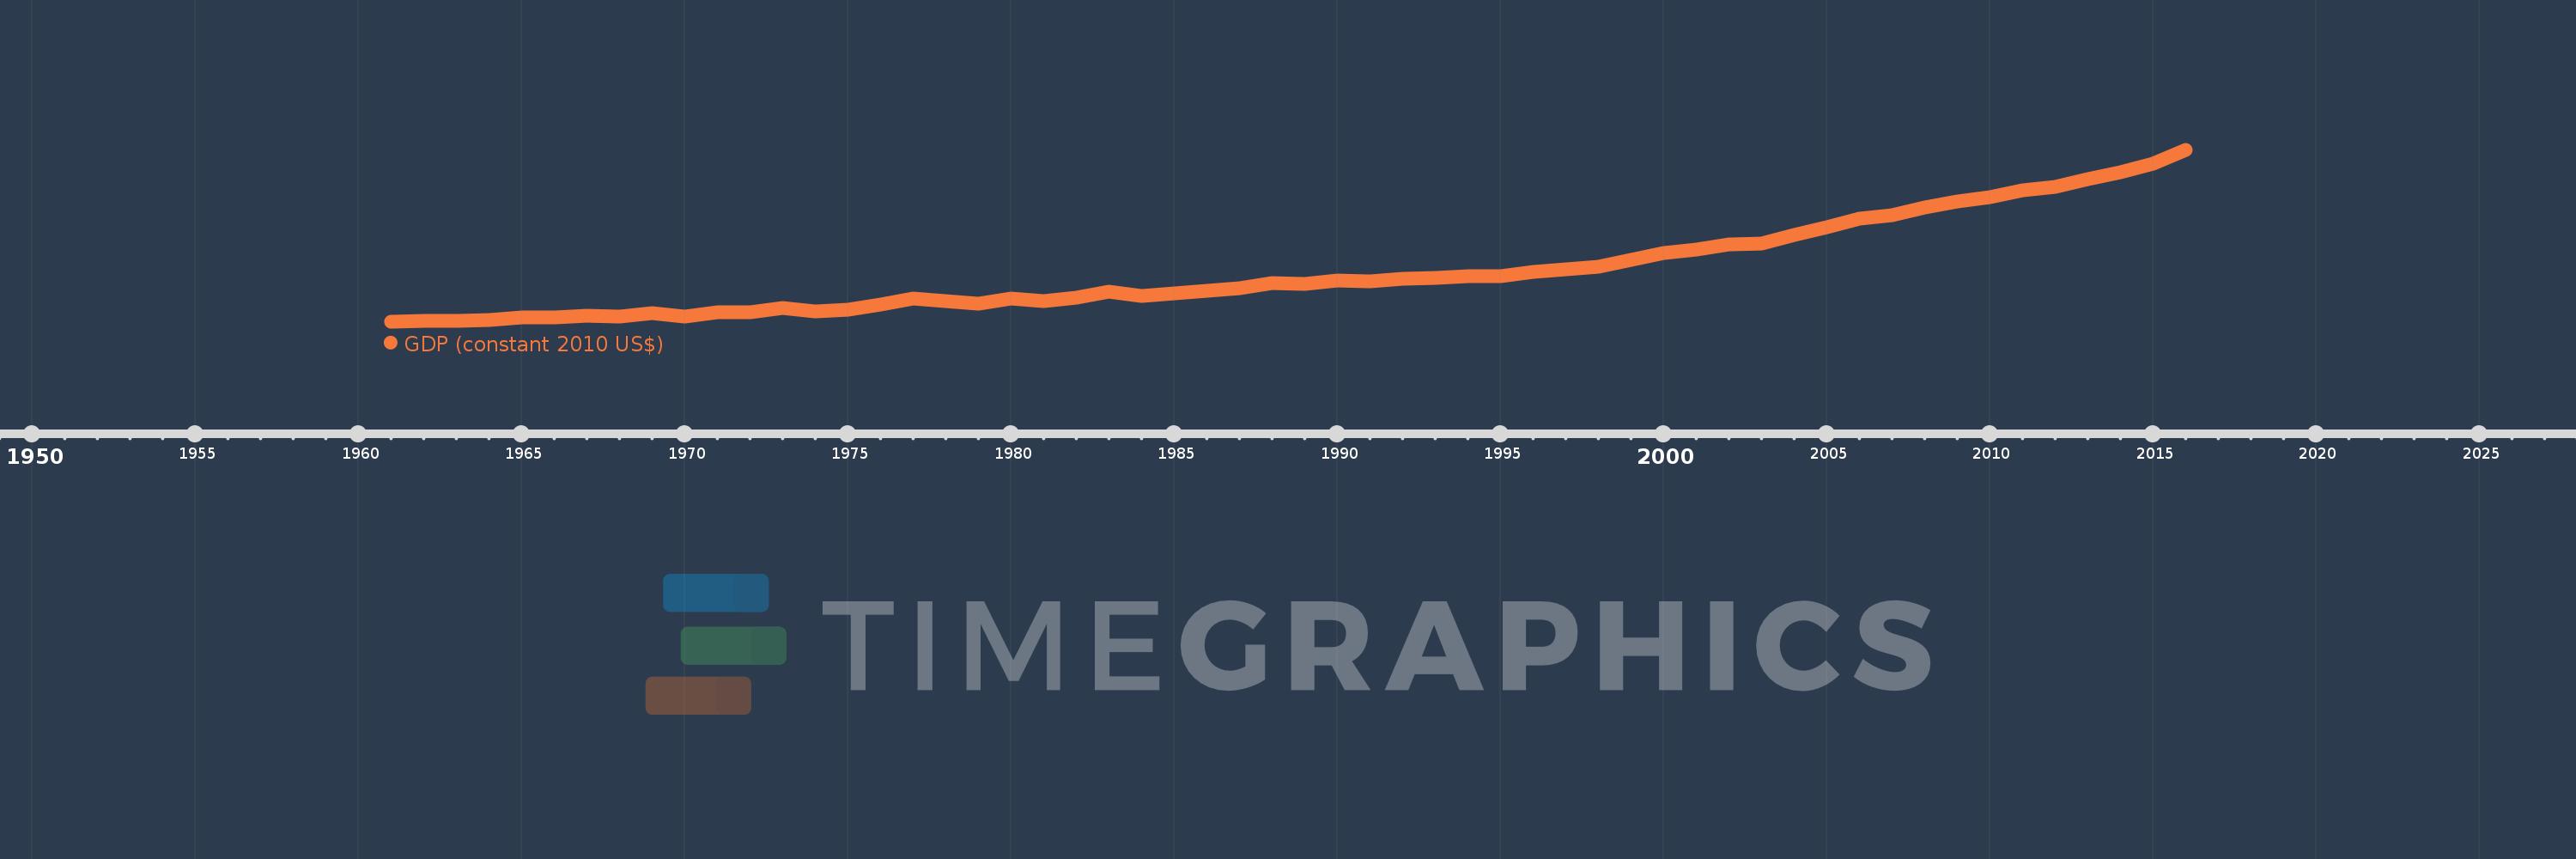
GDP (constant 2010 US$)
2016,2015,2014,2013,2012,2011,2010,2009,2008,2007,2006,2005,2004,2003,2002,2001,2000,1999,1998,1997,1996,1995,1994,1993,1992,1991,1990,1989,1988,1987,1986,1985,1984,1983,1982,1981,1980,1979,1978,1977,1976,1975,1974,1973,1972,1971,1970,1969,1968,1967,1966,1965,1964,1963,1962,1961
Cette statistique dans les autres pays:
AfghanistanAlbaniaAlgeriaAndorraAngolaAntigua and BarbudaArab WorldArgentinaArmeniaArubaAustraliaAustriaAzerbaijanBahamas, TheBahrainBangladeshBarbadosBelarusBelgiumBelizeBeninBermudaBhutanBoliviaBosnia and HerzegovinaBotswanaBrazilBrunei DarussalamBulgariaBurkina FasoBurundiCabo VerdeCambodiaCameroonCanadaCaribbean small statesCentral African RepublicCentral Europe and the BalticsChadChileChinaColombiaComorosCongo, Dem. Rep.Congo, Rep.Costa RicaCote d'IvoireCroatiaCubaCyprusCzech RepublicDenmarkDjiboutiDominicaDominican RepublicEarly-demographic dividendEast Asia & PacificEast Asia & Pacific (excluding high income)East Asia & Pacific (IDA & IBRD countries)EcuadorEgypt, Arab Rep.El SalvadorEquatorial GuineaEritreaEstoniaEthiopiaEuro areaEurope & Central AsiaEurope & Central Asia (excluding high income)Europe & Central Asia (IDA & IBRD countries)European UnionFaroe IslandsFijiFinlandFragile and conflict affected situationsFranceGabonGambia, TheGeorgiaGermanyGhanaGreeceGreenlandGrenadaGuatemalaGuineaGuinea-BissauGuyanaHaitiHeavily indebted poor countries (HIPC)High incomeHondurasHong Kong SAR, ChinaHungaryIBRD onlyIcelandIDA & IBRD totalIDA blendIDA onlyIDA totalIndiaIndonesiaIran, Islamic Rep.IraqIrelandIsle of ManIsraelItalyJamaicaJapanJordanKazakhstanKenyaKiribatiKorea, Rep.KosovoKuwaitKyrgyz RepublicLao PDRLate-demographic dividendLatin America & Caribbean Latin America & Caribbean (excluding high income)Latin America & the Caribbean (IDA & IBRD countries)LatviaLeast developed countries: UN classificationLebanonLesothoLiberiaLibyaLiechtensteinLithuaniaLow & middle incomeLow incomeLower middle incomeLuxembourgMacao SAR, ChinaMacedonia, FYRMadagascarMalawiMalaysiaMaldivesMaliMaltaMarshall IslandsMauritaniaMauritiusMexicoMicronesia, Fed. Sts.Middle East & North AfricaMiddle East & North Africa (excluding high income)Middle East & North Africa (IDA & IBRD countries)Middle incomeMoldovaMonacoMongoliaMontenegroMoroccoMozambiqueMyanmarNamibiaNauruNepalNetherlandsNew ZealandNicaraguaNigerNigeriaNorth AmericaNorwayOECD membersOmanOther small statesPacific island small statesPakistanPalauPanamaPapua New GuineaParaguayPeruPhilippinesPolandPortugalPost-demographic dividendPre-demographic dividendPuerto RicoQatarRomaniaRussian FederationRwandaSamoaSao Tome and PrincipeSaudi ArabiaSenegalSerbiaSeychellesSierra LeoneSingaporeSlovak RepublicSloveniaSmall statesSolomon IslandsSouth AfricaSouth AsiaSouth Asia (IDA & IBRD)South SudanSpainSri LankaSt. Kitts and NevisSt. LuciaSt. Vincent and the GrenadinesSub-Saharan Africa Sub-Saharan Africa (excluding high income)Sub-Saharan Africa (IDA & IBRD countries)SudanSurinameSwazilandSwedenSwitzerlandTajikistanTanzaniaThailandTimor-LesteTogoTongaTrinidad and TobagoTunisiaTurkeyTurkmenistanTuvaluUgandaUkraineUnited Arab EmiratesUnited KingdomUnited StatesUpper middle incomeUruguayUzbekistanVanuatuVenezuela, RBVietnamWest Bank and GazaWorldYemen, Rep.ZambiaZimbabwe La ligne de temps
Cette échelle de temps montre un graphique de 1961 année à 2016 année Senegal. Les données jusqu'à 1960 année ne sont pas présentés. Quantité d'observations actuelles selon dates: 56.
Source (désignation):
Les indicateurs du développement mondiale
Source (organisation):
World Bank national accounts data, and OECD National Accounts data files.
Catégories:
Economy & Growth
Dernière mise à jour
23 avr. 2017
Les indicateurs de changement de valeurs selon les années
Minimum:
3.455 mds
1 janv. 1961
Maximum:
15.772 mds
1 janv. 2016
Pour la date d''observation
Valeur
Changement absolu
Le changement par rapport à la valeur précédente
1 janv. 1961
3.455 mds
+3.455 mds
0.0%
1 janv. 1962
3.558 mds
+103.424 mln.
2.99%
1 janv. 1963
3.554 mds
-4.848 mln.
-0.14%
1 janv. 1964
3.62 mds
+66.256 mln.
1.86%
1 janv. 1965
3.76 mds
+140.593 mln.
3.88%
1 janv. 1966
3.811 mds
+50.096 mln.
1.33%
1 janv. 1967
3.92 mds
+109.62 mln.
2.88%
1 janv. 1968
3.872 mds
-47.818 mln.
-1.22%
1 janv. 1969
4.116 mds
+243.6 mln.
6.29%
1 janv. 1970
3.846 mds
-269.765 mln.
-6.55%
1 janv. 1971
4.175 mds
+329.312 mln.
8.56%
1 janv. 1972
4.17 mds
-5.864 mln.
-0.14%
1 janv. 1973
4.436 mds
+266.156 mln.
6.38%
1 janv. 1974
4.188 mds
-247.661 mln.
-5.58%
1 janv. 1975
4.364 mds
+175.934 mln.
4.2%
1 janv. 1976
4.693 mds
+328.861 mln.
7.54%
1 janv. 1977
5.112 mds
+418.632 mln.
8.92%
1 janv. 1978
4.974 mds
-137.138 mln.
-2.68%
1 janv. 1979
4.778 mds
-196.685 mln.
-3.95%
1 janv. 1980
5.112 mds
+334.521 mln.
7.0%
1 janv. 1981
4.943 mds
-169.249 mln.
-3.31%
1 janv. 1982
5.194 mds
+250.586 mln.
5.07%
1 janv. 1983
5.601 mds
+407.336 mln.
7.84%
1 janv. 1984
5.303 mds
-298.327 mln.
-5.33%
1 janv. 1985
5.501 mds
+198.623 mln.
3.75%
1 janv. 1986
5.682 mds
+180.631 mln.
3.28%
1 janv. 1987
5.859 mds
+176.895 mln.
3.11%
1 janv. 1988
6.216 mds
+357.054 mln.
6.09%
1 janv. 1989
6.179 mds
-36.824 mln.
-0.59%
1 janv. 1990
6.425 mds
+245.791 mln.
3.98%
1 janv. 1991
6.381 mds
-43.408 mln.
-0.68%
1 janv. 1992
6.544 mds
+163.096 mln.
2.56%
1 janv. 1993
6.626 mds
+81.324 mln.
1.24%
1 janv. 1994
6.712 mds
+86.187 mln.
1.3%
1 janv. 1995
6.711 mds
-1.163 mln.
-0.02%
1 janv. 1996
7.071 mds
+359.932 mln.
5.36%
1 janv. 1997
7.213 mds
+142.272 mln.
2.01%
1 janv. 1998
7.438 mds
+225.337 mln.
3.12%
1 janv. 1999
7.877 mds
+438.763 mln.
5.9%
1 janv. 2000
8.378 mds
+500.972 mln.
6.36%
1 janv. 2001
8.645 mds
+266.979 mln.
3.19%
1 janv. 2002
9.041 mds
+396.023 mln.
4.58%
1 janv. 2003
9.1 mds
+59.201 mln.
0.65%
1 janv. 2004
9.708 mds
+608.192 mln.
6.68%
1 janv. 2005
10.278 mds
+569.962 mln.
5.87%
1 janv. 2006
10.856 mds
+577.916 mln.
5.62%
1 janv. 2007
11.124 mds
+267.237 mln.
2.46%
1 janv. 2008
11.673 mds
+549.337 mln.
4.94%
1 janv. 2009
12.103 mds
+429.858 mln.
3.68%
1 janv. 2010
12.396 mds
+293.272 mln.
2.42%
1 janv. 2011
12.914 mds
+518.076 mln.
4.18%
1 janv. 2012
13.142 mds
+227.433 mln.
1.76%
1 janv. 2013
13.721 mds
+579.698 mln.
4.41%
1 janv. 2014
14.199 mds
+478.216 mln.
3.49%
1 janv. 2015
14.812 mds
+612.147 mln.
4.31%
1 janv. 2016
15.772 mds
+960.563 mln.
6.49%
Classement des pays selon les statistiques actuelles par années


Commentaires: