29
/fr/
fr
AIzaSyAYiBZKx7MnpbEhh9jyipgxe19OcubqV5w
April 1, 2024
168621
Kiribati
KIR
true
2
1
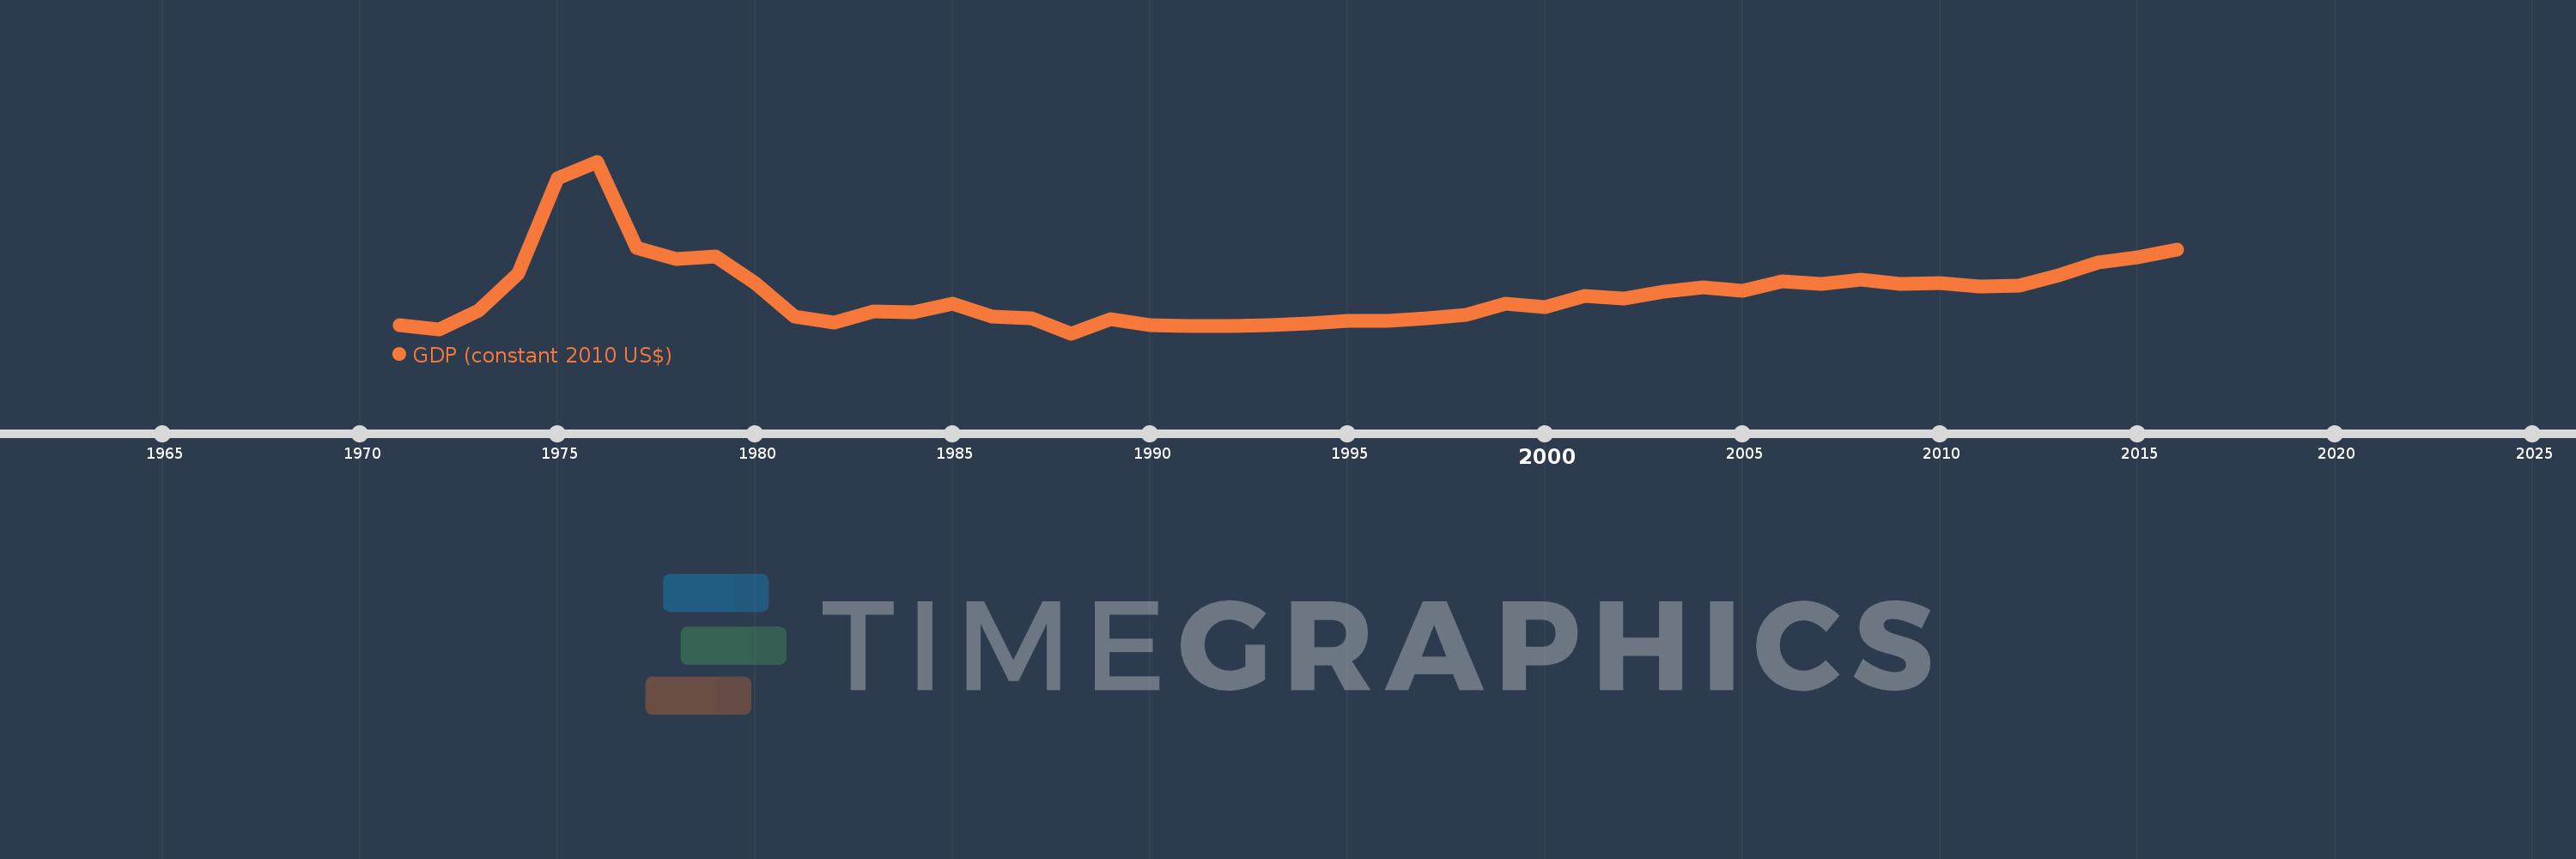
GDP (constant 2010 US$)
2016,2015,2014,2013,2012,2011,2010,2009,2008,2007,2006,2005,2004,2003,2002,2001,2000,1999,1998,1997,1996,1995,1994,1993,1992,1991,1990,1989,1988,1987,1986,1985,1984,1983,1982,1981,1980,1979,1978,1977,1976,1975,1974,1973,1972,1971
Cette statistique dans les autres pays:
AfghanistanAlbaniaAlgeriaAndorraAngolaAntigua and BarbudaArab WorldArgentinaArmeniaArubaAustraliaAustriaAzerbaijanBahamas, TheBahrainBangladeshBarbadosBelarusBelgiumBelizeBeninBermudaBhutanBoliviaBosnia and HerzegovinaBotswanaBrazilBrunei DarussalamBulgariaBurkina FasoBurundiCabo VerdeCambodiaCameroonCanadaCaribbean small statesCentral African RepublicCentral Europe and the BalticsChadChileChinaColombiaComorosCongo, Dem. Rep.Congo, Rep.Costa RicaCote d'IvoireCroatiaCubaCyprusCzech RepublicDenmarkDjiboutiDominicaDominican RepublicEarly-demographic dividendEast Asia & PacificEast Asia & Pacific (excluding high income)East Asia & Pacific (IDA & IBRD countries)EcuadorEgypt, Arab Rep.El SalvadorEquatorial GuineaEritreaEstoniaEthiopiaEuro areaEurope & Central AsiaEurope & Central Asia (excluding high income)Europe & Central Asia (IDA & IBRD countries)European UnionFaroe IslandsFijiFinlandFragile and conflict affected situationsFranceGabonGambia, TheGeorgiaGermanyGhanaGreeceGreenlandGrenadaGuatemalaGuineaGuinea-BissauGuyanaHaitiHeavily indebted poor countries (HIPC)High incomeHondurasHong Kong SAR, ChinaHungaryIBRD onlyIcelandIDA & IBRD totalIDA blendIDA onlyIDA totalIndiaIndonesiaIran, Islamic Rep.IraqIrelandIsle of ManIsraelItalyJamaicaJapanJordanKazakhstanKenyaKiribatiKorea, Rep.KosovoKuwaitKyrgyz RepublicLao PDRLate-demographic dividendLatin America & Caribbean Latin America & Caribbean (excluding high income)Latin America & the Caribbean (IDA & IBRD countries)LatviaLeast developed countries: UN classificationLebanonLesothoLiberiaLibyaLiechtensteinLithuaniaLow & middle incomeLow incomeLower middle incomeLuxembourgMacao SAR, ChinaMacedonia, FYRMadagascarMalawiMalaysiaMaldivesMaliMaltaMarshall IslandsMauritaniaMauritiusMexicoMicronesia, Fed. Sts.Middle East & North AfricaMiddle East & North Africa (excluding high income)Middle East & North Africa (IDA & IBRD countries)Middle incomeMoldovaMonacoMongoliaMontenegroMoroccoMozambiqueMyanmarNamibiaNauruNepalNetherlandsNew ZealandNicaraguaNigerNigeriaNorth AmericaNorwayOECD membersOmanOther small statesPacific island small statesPakistanPalauPanamaPapua New GuineaParaguayPeruPhilippinesPolandPortugalPost-demographic dividendPre-demographic dividendPuerto RicoQatarRomaniaRussian FederationRwandaSamoaSao Tome and PrincipeSaudi ArabiaSenegalSerbiaSeychellesSierra LeoneSingaporeSlovak RepublicSloveniaSmall statesSolomon IslandsSouth AfricaSouth AsiaSouth Asia (IDA & IBRD)South SudanSpainSri LankaSt. Kitts and NevisSt. LuciaSt. Vincent and the GrenadinesSub-Saharan Africa Sub-Saharan Africa (excluding high income)Sub-Saharan Africa (IDA & IBRD countries)SudanSurinameSwazilandSwedenSwitzerlandTajikistanTanzaniaThailandTimor-LesteTogoTongaTrinidad and TobagoTunisiaTurkeyTurkmenistanTuvaluUgandaUkraineUnited Arab EmiratesUnited KingdomUnited StatesUpper middle incomeUruguayUzbekistanVanuatuVenezuela, RBVietnamWest Bank and GazaWorldYemen, Rep.ZambiaZimbabwe La ligne de temps
Cette échelle de temps montre un graphique de 1971 année à 2016 année Kiribati. Les données jusqu'à 1970 année ne sont pas présentés. Quantité d'observations actuelles selon dates: 46.
Source (désignation):
Les indicateurs du développement mondiale
Source (organisation):
World Bank national accounts data, and OECD National Accounts data files.
Catégories:
Economy & Growth
Dernière mise à jour
23 avr. 2017
Les indicateurs de changement de valeurs selon les années
Minimum:
117.088 mln.
1 janv. 1988
Maximum:
249.419 mln.
1 janv. 1976
Pour la date d''observation
Valeur
Changement absolu
Le changement par rapport à la valeur précédente
1 janv. 1971
123.06 mln.
+123.06 mln.
0.0%
1 janv. 1972
120.242 mln.
-2.818 mln.
-2.29%
1 janv. 1973
134.767 mln.
+14.524 mln.
12.08%
1 janv. 1974
162.946 mln.
+28.18 mln.
20.91%
1 janv. 1975
236.765 mln.
+73.819 mln.
45.3%
1 janv. 1976
249.419 mln.
+12.654 mln.
5.34%
1 janv. 1977
182.654 mln.
-66.765 mln.
-26.77%
1 janv. 1978
174.229 mln.
-8.425 mln.
-4.61%
1 janv. 1979
176.075 mln.
+1.846 mln.
1.06%
1 janv. 1980
155.677 mln.
-20.398 mln.
-11.58%
1 janv. 1981
129.978 mln.
-25.699 mln.
-16.51%
1 janv. 1982
125.681 mln.
-4.297 mln.
-3.31%
1 janv. 1983
134.275 mln.
+8.594 mln.
6.84%
1 janv. 1984
133.201 mln.
-1.074 mln.
-0.8%
1 janv. 1985
139.646 mln.
+6.445 mln.
4.84%
1 janv. 1986
129.978 mln.
-9.668 mln.
-6.92%
1 janv. 1987
128.904 mln.
-1.074 mln.
-0.83%
1 janv. 1988
117.088 mln.
-11.816 mln.
-9.17%
1 janv. 1989
127.83 mln.
+10.742 mln.
9.17%
1 janv. 1990
123.533 mln.
-4.297 mln.
-3.36%
1 janv. 1991
122.459 mln.
-1.074 mln.
-0.87%
1 janv. 1992
122.459 mln.
0.0
0.0%
1 janv. 1993
123.533 mln.
+1.074 mln.
0.88%
1 janv. 1994
124.607 mln.
+1.074 mln.
0.87%
1 janv. 1995
126.755 mln.
+2.148 mln.
1.72%
1 janv. 1996
126.755 mln.
0.0
0.0%
1 janv. 1997
128.904 mln.
+2.148 mln.
1.69%
1 janv. 1998
131.052 mln.
+2.148 mln.
1.67%
1 janv. 1999
139.646 mln.
+8.594 mln.
6.56%
1 janv. 2000
137.497 mln.
-2.148 mln.
-1.54%
1 janv. 2001
146.091 mln.
+8.594 mln.
6.25%
1 janv. 2002
143.943 mln.
-2.148 mln.
-1.47%
1 janv. 2003
149.394 mln.
+5.452 mln.
3.79%
1 janv. 2004
152.392 mln.
+2.997 mln.
2.01%
1 janv. 2005
149.909 mln.
-2.483 mln.
-1.63%
1 janv. 2006
157.332 mln.
+7.423 mln.
4.95%
1 janv. 2007
154.844 mln.
-2.487 mln.
-1.58%
1 janv. 2008
158.254 mln.
+3.41 mln.
2.2%
1 janv. 2009
155.33 mln.
-2.924 mln.
-1.85%
1 janv. 2010
155.78 mln.
+449.874 milles
0.29%
1 janv. 2011
153.276 mln.
-2.504 mln.
-1.61%
1 janv. 2012
154.007 mln.
+730.884 milles
0.48%
1 janv. 2013
161.996 mln.
+7.99 mln.
5.19%
1 janv. 2014
171.363 mln.
+9.367 mln.
5.78%
1 janv. 2015
175.491 mln.
+4.128 mln.
2.41%
1 janv. 2016
181.628 mln.
+6.137 mln.
3.5%
Classement des pays selon les statistiques actuelles par années


Commentaires: