29
/fr/
fr
AIzaSyAYiBZKx7MnpbEhh9jyipgxe19OcubqV5w
April 1, 2024
146836
Guinea-Bissau
GNB
true
2
1
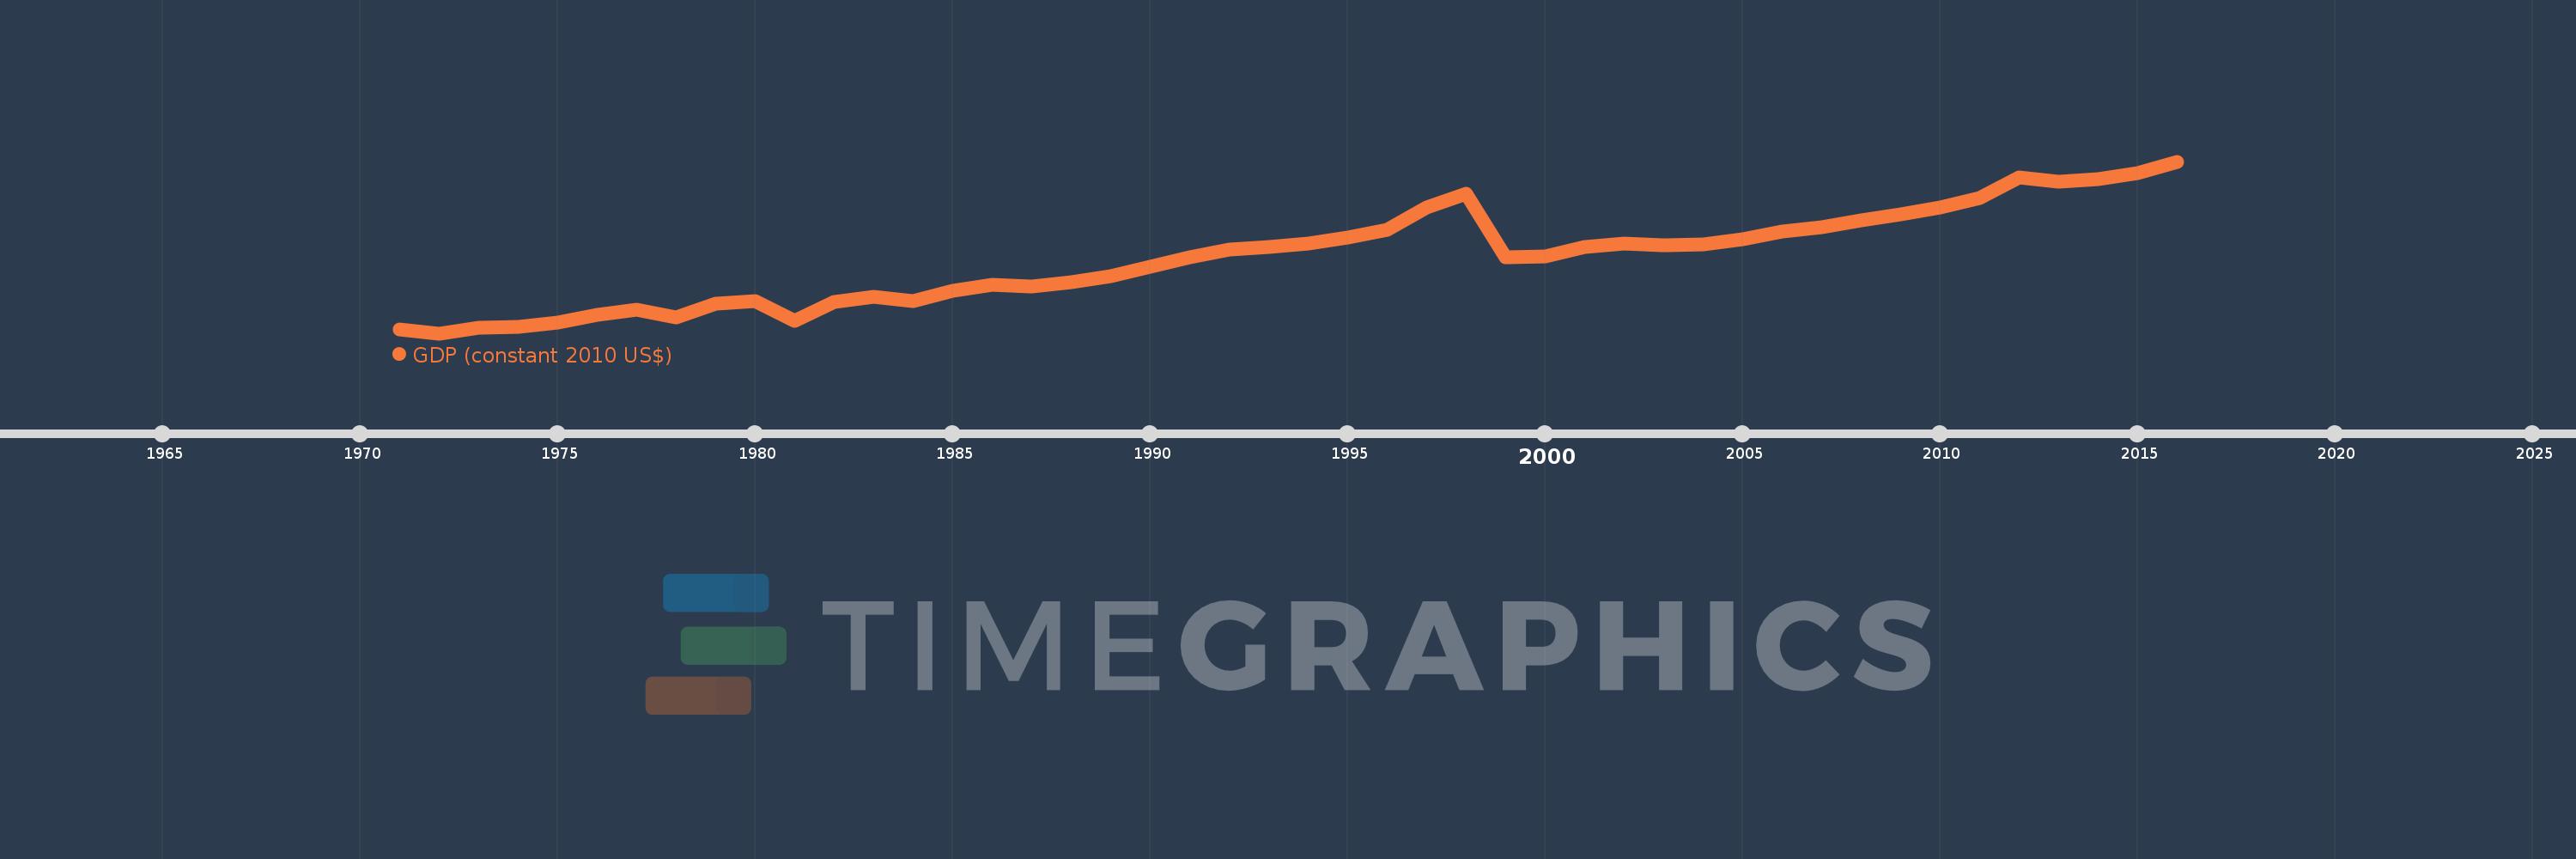
GDP (constant 2010 US$)
2016,2015,2014,2013,2012,2011,2010,2009,2008,2007,2006,2005,2004,2003,2002,2001,2000,1999,1998,1997,1996,1995,1994,1993,1992,1991,1990,1989,1988,1987,1986,1985,1984,1983,1982,1981,1980,1979,1978,1977,1976,1975,1974,1973,1972,1971
Cette statistique dans les autres pays:
AfghanistanAlbaniaAlgeriaAndorraAngolaAntigua and BarbudaArab WorldArgentinaArmeniaArubaAustraliaAustriaAzerbaijanBahamas, TheBahrainBangladeshBarbadosBelarusBelgiumBelizeBeninBermudaBhutanBoliviaBosnia and HerzegovinaBotswanaBrazilBrunei DarussalamBulgariaBurkina FasoBurundiCabo VerdeCambodiaCameroonCanadaCaribbean small statesCentral African RepublicCentral Europe and the BalticsChadChileChinaColombiaComorosCongo, Dem. Rep.Congo, Rep.Costa RicaCote d'IvoireCroatiaCubaCyprusCzech RepublicDenmarkDjiboutiDominicaDominican RepublicEarly-demographic dividendEast Asia & PacificEast Asia & Pacific (excluding high income)East Asia & Pacific (IDA & IBRD countries)EcuadorEgypt, Arab Rep.El SalvadorEquatorial GuineaEritreaEstoniaEthiopiaEuro areaEurope & Central AsiaEurope & Central Asia (excluding high income)Europe & Central Asia (IDA & IBRD countries)European UnionFaroe IslandsFijiFinlandFragile and conflict affected situationsFranceGabonGambia, TheGeorgiaGermanyGhanaGreeceGreenlandGrenadaGuatemalaGuineaGuinea-BissauGuyanaHaitiHeavily indebted poor countries (HIPC)High incomeHondurasHong Kong SAR, ChinaHungaryIBRD onlyIcelandIDA & IBRD totalIDA blendIDA onlyIDA totalIndiaIndonesiaIran, Islamic Rep.IraqIrelandIsle of ManIsraelItalyJamaicaJapanJordanKazakhstanKenyaKiribatiKorea, Rep.KosovoKuwaitKyrgyz RepublicLao PDRLate-demographic dividendLatin America & Caribbean Latin America & Caribbean (excluding high income)Latin America & the Caribbean (IDA & IBRD countries)LatviaLeast developed countries: UN classificationLebanonLesothoLiberiaLibyaLiechtensteinLithuaniaLow & middle incomeLow incomeLower middle incomeLuxembourgMacao SAR, ChinaMacedonia, FYRMadagascarMalawiMalaysiaMaldivesMaliMaltaMarshall IslandsMauritaniaMauritiusMexicoMicronesia, Fed. Sts.Middle East & North AfricaMiddle East & North Africa (excluding high income)Middle East & North Africa (IDA & IBRD countries)Middle incomeMoldovaMonacoMongoliaMontenegroMoroccoMozambiqueMyanmarNamibiaNauruNepalNetherlandsNew ZealandNicaraguaNigerNigeriaNorth AmericaNorwayOECD membersOmanOther small statesPacific island small statesPakistanPalauPanamaPapua New GuineaParaguayPeruPhilippinesPolandPortugalPost-demographic dividendPre-demographic dividendPuerto RicoQatarRomaniaRussian FederationRwandaSamoaSao Tome and PrincipeSaudi ArabiaSenegalSerbiaSeychellesSierra LeoneSingaporeSlovak RepublicSloveniaSmall statesSolomon IslandsSouth AfricaSouth AsiaSouth Asia (IDA & IBRD)South SudanSpainSri LankaSt. Kitts and NevisSt. LuciaSt. Vincent and the GrenadinesSub-Saharan Africa Sub-Saharan Africa (excluding high income)Sub-Saharan Africa (IDA & IBRD countries)SudanSurinameSwazilandSwedenSwitzerlandTajikistanTanzaniaThailandTimor-LesteTogoTongaTrinidad and TobagoTunisiaTurkeyTurkmenistanTuvaluUgandaUkraineUnited Arab EmiratesUnited KingdomUnited StatesUpper middle incomeUruguayUzbekistanVanuatuVenezuela, RBVietnamWest Bank and GazaWorldYemen, Rep.ZambiaZimbabwe La ligne de temps
Cette échelle de temps montre un graphique de 1971 année à 2016 année Guinea-Bissau. Les données jusqu'à 1970 année ne sont pas présentés. Quantité d'observations actuelles selon dates: 46.
Source (désignation):
Les indicateurs du développement mondiale
Source (organisation):
World Bank national accounts data, and OECD National Accounts data files.
Catégories:
Economy & Growth
Dernière mise à jour
23 avr. 2017
Les indicateurs de changement de valeurs selon les années
Minimum:
333.31 mln.
1 janv. 1972
Maximum:
984.489 mln.
1 janv. 2016
Pour la date d''observation
Valeur
Changement absolu
Le changement par rapport à la valeur précédente
1 janv. 1971
346.876 mln.
+346.876 mln.
0.0%
1 janv. 1972
333.31 mln.
-13.566 mln.
-3.91%
1 janv. 1973
354.558 mln.
+21.248 mln.
6.37%
1 janv. 1974
358.493 mln.
+3.935 mln.
1.11%
1 janv. 1975
374.838 mln.
+16.345 mln.
4.56%
1 janv. 1976
404.246 mln.
+29.408 mln.
7.85%
1 janv. 1977
424.23 mln.
+19.984 mln.
4.94%
1 janv. 1978
393.812 mln.
-30.418 mln.
-7.17%
1 janv. 1979
445.504 mln.
+51.692 mln.
13.13%
1 janv. 1980
454.388 mln.
+8.884 mln.
1.99%
1 janv. 1981
381.901 mln.
-72.487 mln.
-15.95%
1 janv. 1982
451.283 mln.
+69.382 mln.
18.17%
1 janv. 1983
470.237 mln.
+18.954 mln.
4.2%
1 janv. 1984
454.257 mln.
-15.98 mln.
-3.4%
1 janv. 1985
495.637 mln.
+41.379 mln.
9.11%
1 janv. 1986
516.287 mln.
+20.651 mln.
4.17%
1 janv. 1987
512.189 mln.
-4.099 mln.
-0.79%
1 janv. 1988
527.042 mln.
+14.853 mln.
2.9%
1 janv. 1989
551.286 mln.
+24.244 mln.
4.6%
1 janv. 1990
584.915 mln.
+33.628 mln.
6.1%
1 janv. 1991
620.595 mln.
+35.68 mln.
6.1%
1 janv. 1992
652.245 mln.
+31.65 mln.
5.1%
1 janv. 1993
659.42 mln.
+7.175 mln.
1.1%
1 janv. 1994
673.267 mln.
+13.848 mln.
2.1%
1 janv. 1995
694.812 mln.
+21.545 mln.
3.2%
1 janv. 1996
725.384 mln.
+30.572 mln.
4.4%
1 janv. 1997
809.528 mln.
+84.145 mln.
11.6%
1 janv. 1998
862.148 mln.
+52.619 mln.
6.5%
1 janv. 1999
619.884 mln.
-242.263 mln.
-28.1%
1 janv. 2000
626.241 mln.
+6.357 mln.
1.03%
1 janv. 2001
660.227 mln.
+33.986 mln.
5.43%
1 janv. 2002
674.679 mln.
+14.452 mln.
2.19%
1 janv. 2003
668.032 mln.
-6.647 mln.
-0.99%
1 janv. 2004
671.83 mln.
+3.798 mln.
0.57%
1 janv. 2005
690.382 mln.
+18.552 mln.
2.76%
1 janv. 2006
719.83 mln.
+29.448 mln.
4.27%
1 janv. 2007
736.456 mln.
+16.626 mln.
2.31%
1 janv. 2008
760.06 mln.
+23.604 mln.
3.21%
1 janv. 2009
784.438 mln.
+24.378 mln.
3.21%
1 janv. 2010
810.416 mln.
+25.978 mln.
3.31%
1 janv. 2011
846.332 mln.
+35.916 mln.
4.43%
1 janv. 2012
925.33 mln.
+78.998 mln.
9.33%
1 janv. 2013
908.693 mln.
-16.637 mln.
-1.8%
1 janv. 2014
916.147 mln.
+7.454 mln.
0.82%
1 janv. 2015
939.427 mln.
+23.28 mln.
2.54%
1 janv. 2016
984.489 mln.
+45.062 mln.
4.8%
Classement des pays selon les statistiques actuelles par années


Commentaires: