29
/fr/
fr
AIzaSyAYiBZKx7MnpbEhh9jyipgxe19OcubqV5w
April 1, 2024
142984
Grenada
GRD
true
2
1
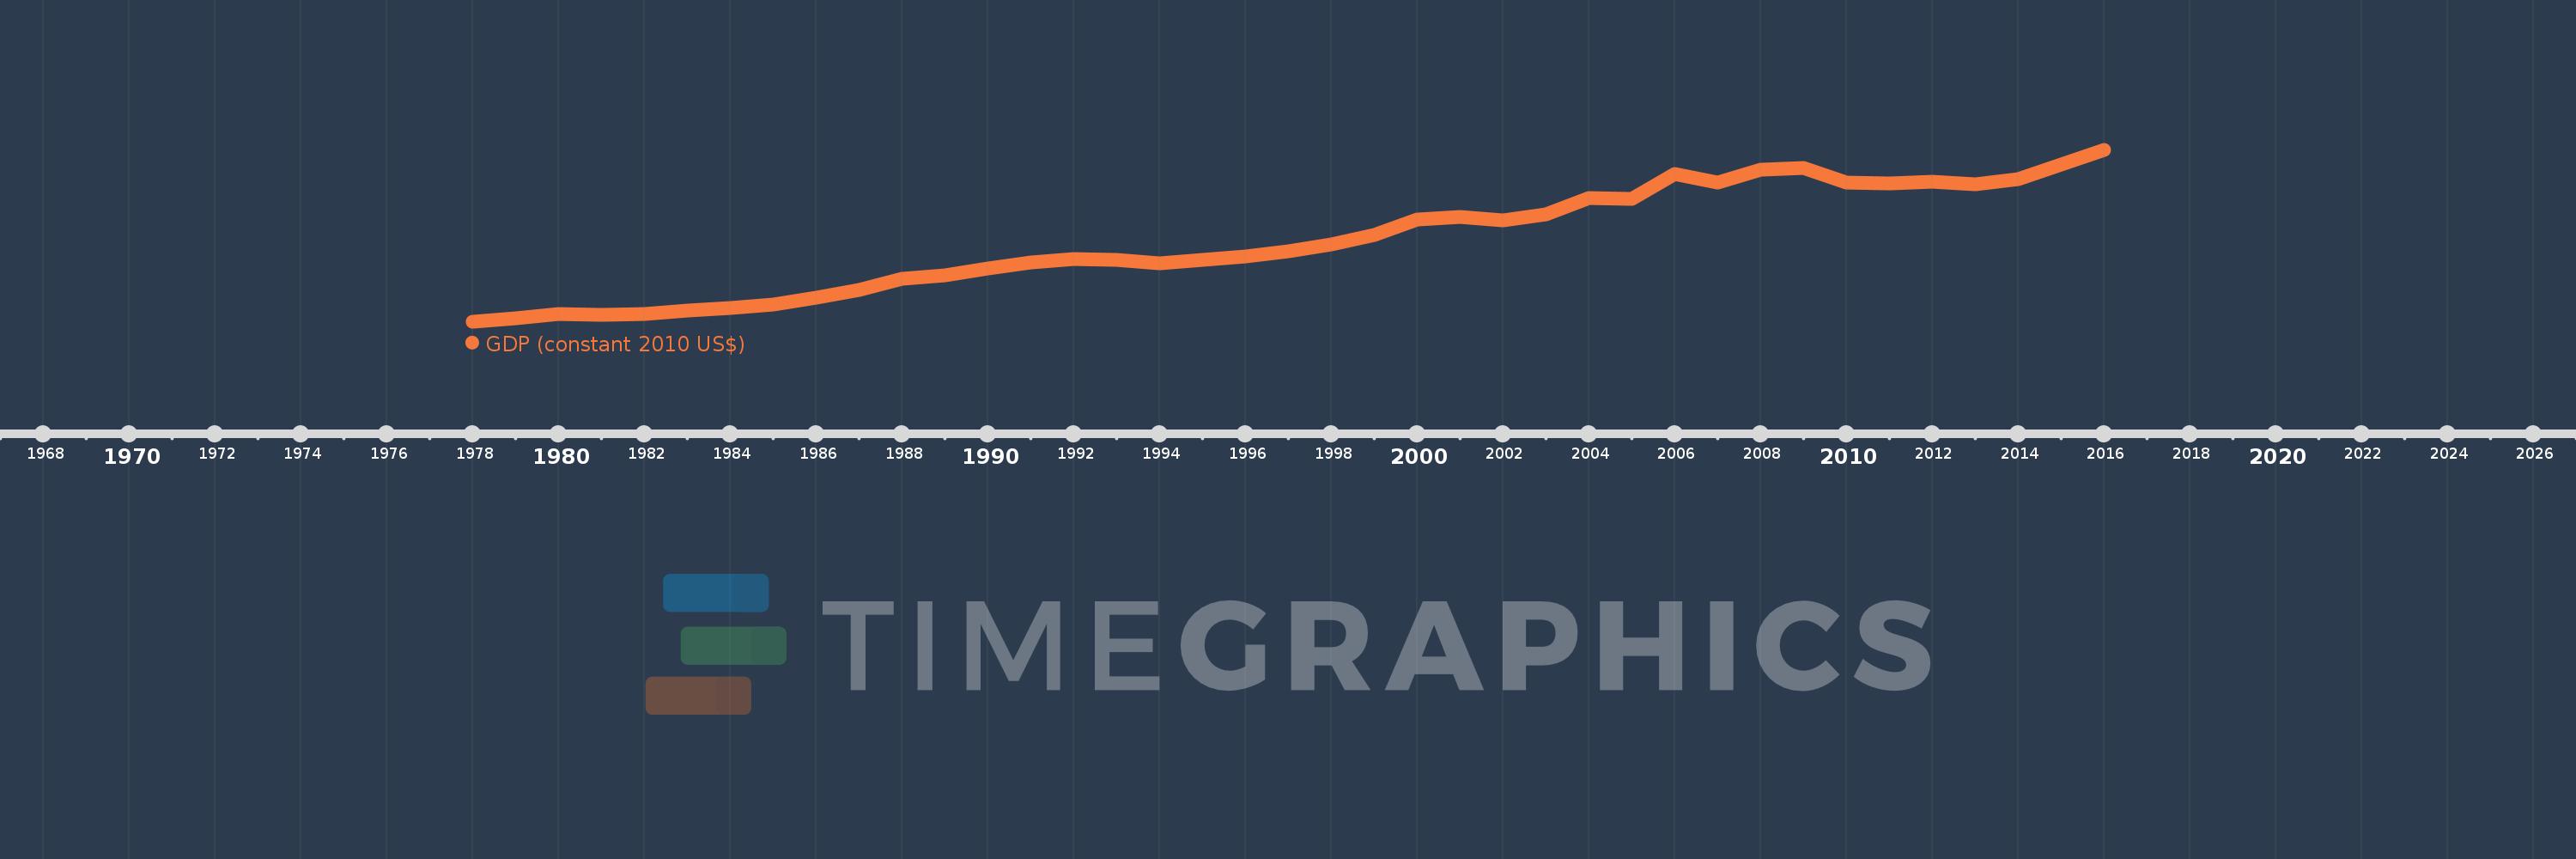
GDP (constant 2010 US$)
2016,2015,2014,2013,2012,2011,2010,2009,2008,2007,2006,2005,2004,2003,2002,2001,2000,1999,1998,1997,1996,1995,1994,1993,1992,1991,1990,1989,1988,1987,1986,1985,1984,1983,1982,1981,1980,1979,1978
Cette statistique dans les autres pays:
AfghanistanAlbaniaAlgeriaAndorraAngolaAntigua and BarbudaArab WorldArgentinaArmeniaArubaAustraliaAustriaAzerbaijanBahamas, TheBahrainBangladeshBarbadosBelarusBelgiumBelizeBeninBermudaBhutanBoliviaBosnia and HerzegovinaBotswanaBrazilBrunei DarussalamBulgariaBurkina FasoBurundiCabo VerdeCambodiaCameroonCanadaCaribbean small statesCentral African RepublicCentral Europe and the BalticsChadChileChinaColombiaComorosCongo, Dem. Rep.Congo, Rep.Costa RicaCote d'IvoireCroatiaCubaCyprusCzech RepublicDenmarkDjiboutiDominicaDominican RepublicEarly-demographic dividendEast Asia & PacificEast Asia & Pacific (excluding high income)East Asia & Pacific (IDA & IBRD countries)EcuadorEgypt, Arab Rep.El SalvadorEquatorial GuineaEritreaEstoniaEthiopiaEuro areaEurope & Central AsiaEurope & Central Asia (excluding high income)Europe & Central Asia (IDA & IBRD countries)European UnionFaroe IslandsFijiFinlandFragile and conflict affected situationsFranceGabonGambia, TheGeorgiaGermanyGhanaGreeceGreenlandGrenadaGuatemalaGuineaGuinea-BissauGuyanaHaitiHeavily indebted poor countries (HIPC)High incomeHondurasHong Kong SAR, ChinaHungaryIBRD onlyIcelandIDA & IBRD totalIDA blendIDA onlyIDA totalIndiaIndonesiaIran, Islamic Rep.IraqIrelandIsle of ManIsraelItalyJamaicaJapanJordanKazakhstanKenyaKiribatiKorea, Rep.KosovoKuwaitKyrgyz RepublicLao PDRLate-demographic dividendLatin America & Caribbean Latin America & Caribbean (excluding high income)Latin America & the Caribbean (IDA & IBRD countries)LatviaLeast developed countries: UN classificationLebanonLesothoLiberiaLibyaLiechtensteinLithuaniaLow & middle incomeLow incomeLower middle incomeLuxembourgMacao SAR, ChinaMacedonia, FYRMadagascarMalawiMalaysiaMaldivesMaliMaltaMarshall IslandsMauritaniaMauritiusMexicoMicronesia, Fed. Sts.Middle East & North AfricaMiddle East & North Africa (excluding high income)Middle East & North Africa (IDA & IBRD countries)Middle incomeMoldovaMonacoMongoliaMontenegroMoroccoMozambiqueMyanmarNamibiaNauruNepalNetherlandsNew ZealandNicaraguaNigerNigeriaNorth AmericaNorwayOECD membersOmanOther small statesPacific island small statesPakistanPalauPanamaPapua New GuineaParaguayPeruPhilippinesPolandPortugalPost-demographic dividendPre-demographic dividendPuerto RicoQatarRomaniaRussian FederationRwandaSamoaSao Tome and PrincipeSaudi ArabiaSenegalSerbiaSeychellesSierra LeoneSingaporeSlovak RepublicSloveniaSmall statesSolomon IslandsSouth AfricaSouth AsiaSouth Asia (IDA & IBRD)South SudanSpainSri LankaSt. Kitts and NevisSt. LuciaSt. Vincent and the GrenadinesSub-Saharan Africa Sub-Saharan Africa (excluding high income)Sub-Saharan Africa (IDA & IBRD countries)SudanSurinameSwazilandSwedenSwitzerlandTajikistanTanzaniaThailandTimor-LesteTogoTongaTrinidad and TobagoTunisiaTurkeyTurkmenistanTuvaluUgandaUkraineUnited Arab EmiratesUnited KingdomUnited StatesUpper middle incomeUruguayUzbekistanVanuatuVenezuela, RBVietnamWest Bank and GazaWorldYemen, Rep.ZambiaZimbabwe La ligne de temps
Cette échelle de temps montre un graphique de 1978 année à 2016 année Grenada. Les données jusqu'à 1977 année ne sont pas présentés. Quantité d'observations actuelles selon dates: 39.
Source (désignation):
Les indicateurs du développement mondiale
Source (organisation):
World Bank national accounts data, and OECD National Accounts data files.
Catégories:
Economy & Growth
Dernière mise à jour
23 avr. 2017
Les indicateurs de changement de valeurs selon les années
Minimum:
249.334 mln.
1 janv. 1978
Maximum:
896.385 mln.
1 janv. 2016
Pour la date d''observation
Valeur
Changement absolu
Le changement par rapport à la valeur précédente
1 janv. 1978
249.334 mln.
+249.334 mln.
0.0%
1 janv. 1979
262.834 mln.
+13.501 mln.
5.41%
1 janv. 1980
278.636 mln.
+15.801 mln.
6.01%
1 janv. 1981
277.394 mln.
-1.242 mln.
-0.45%
1 janv. 1982
279.758 mln.
+2.364 mln.
0.85%
1 janv. 1983
293.537 mln.
+13.779 mln.
4.93%
1 janv. 1984
302.127 mln.
+8.589 mln.
2.93%
1 janv. 1985
316.583 mln.
+14.456 mln.
4.78%
1 janv. 1986
342.167 mln.
+25.585 mln.
8.08%
1 janv. 1987
370.394 mln.
+28.227 mln.
8.25%
1 janv. 1988
411.693 mln.
+41.298 mln.
11.15%
1 janv. 1989
425.806 mln.
+14.114 mln.
3.43%
1 janv. 1990
451.662 mln.
+25.855 mln.
6.07%
1 janv. 1991
475.145 mln.
+23.483 mln.
5.2%
1 janv. 1992
486.058 mln.
+10.914 mln.
2.3%
1 janv. 1993
484.617 mln.
-1.441 mln.
-0.3%
1 janv. 1994
471.825 mln.
-12.792 mln.
-2.64%
1 janv. 1995
484.816 mln.
+12.991 mln.
2.75%
1 janv. 1996
496.956 mln.
+12.14 mln.
2.5%
1 janv. 1997
517.119 mln.
+20.164 mln.
4.06%
1 janv. 1998
540.953 mln.
+23.833 mln.
4.61%
1 janv. 1999
576.341 mln.
+35.389 mln.
6.54%
1 janv. 2000
634.393 mln.
+58.052 mln.
10.07%
1 janv. 2001
646.275 mln.
+11.882 mln.
1.87%
1 janv. 2002
633.195 mln.
-13.08 mln.
-2.02%
1 janv. 2003
654.96 mln.
+21.765 mln.
3.44%
1 janv. 2004
716.945 mln.
+61.985 mln.
9.46%
1 janv. 2005
712.303 mln.
-4.642 mln.
-0.65%
1 janv. 2006
806.848 mln.
+94.544 mln.
13.27%
1 janv. 2007
774.431 mln.
-32.417 mln.
-4.02%
1 janv. 2008
822.063 mln.
+47.632 mln.
6.15%
1 janv. 2009
829.865 mln.
+7.802 mln.
0.95%
1 janv. 2010
774.978 mln.
-54.886 mln.
-6.61%
1 janv. 2011
771.016 mln.
-3.962 mln.
-0.51%
1 janv. 2012
776.913 mln.
+5.897 mln.
0.76%
1 janv. 2013
767.937 mln.
-8.976 mln.
-1.16%
1 janv. 2014
786.001 mln.
+18.064 mln.
2.35%
1 janv. 2015
843.826 mln.
+57.824 mln.
7.36%
1 janv. 2016
896.385 mln.
+52.559 mln.
6.23%
Classement des pays selon les statistiques actuelles par années


Commentaires: