29
/fr/
fr
AIzaSyAYiBZKx7MnpbEhh9jyipgxe19OcubqV5w
April 1, 2024
108508
Comoros
COM
true
2
1
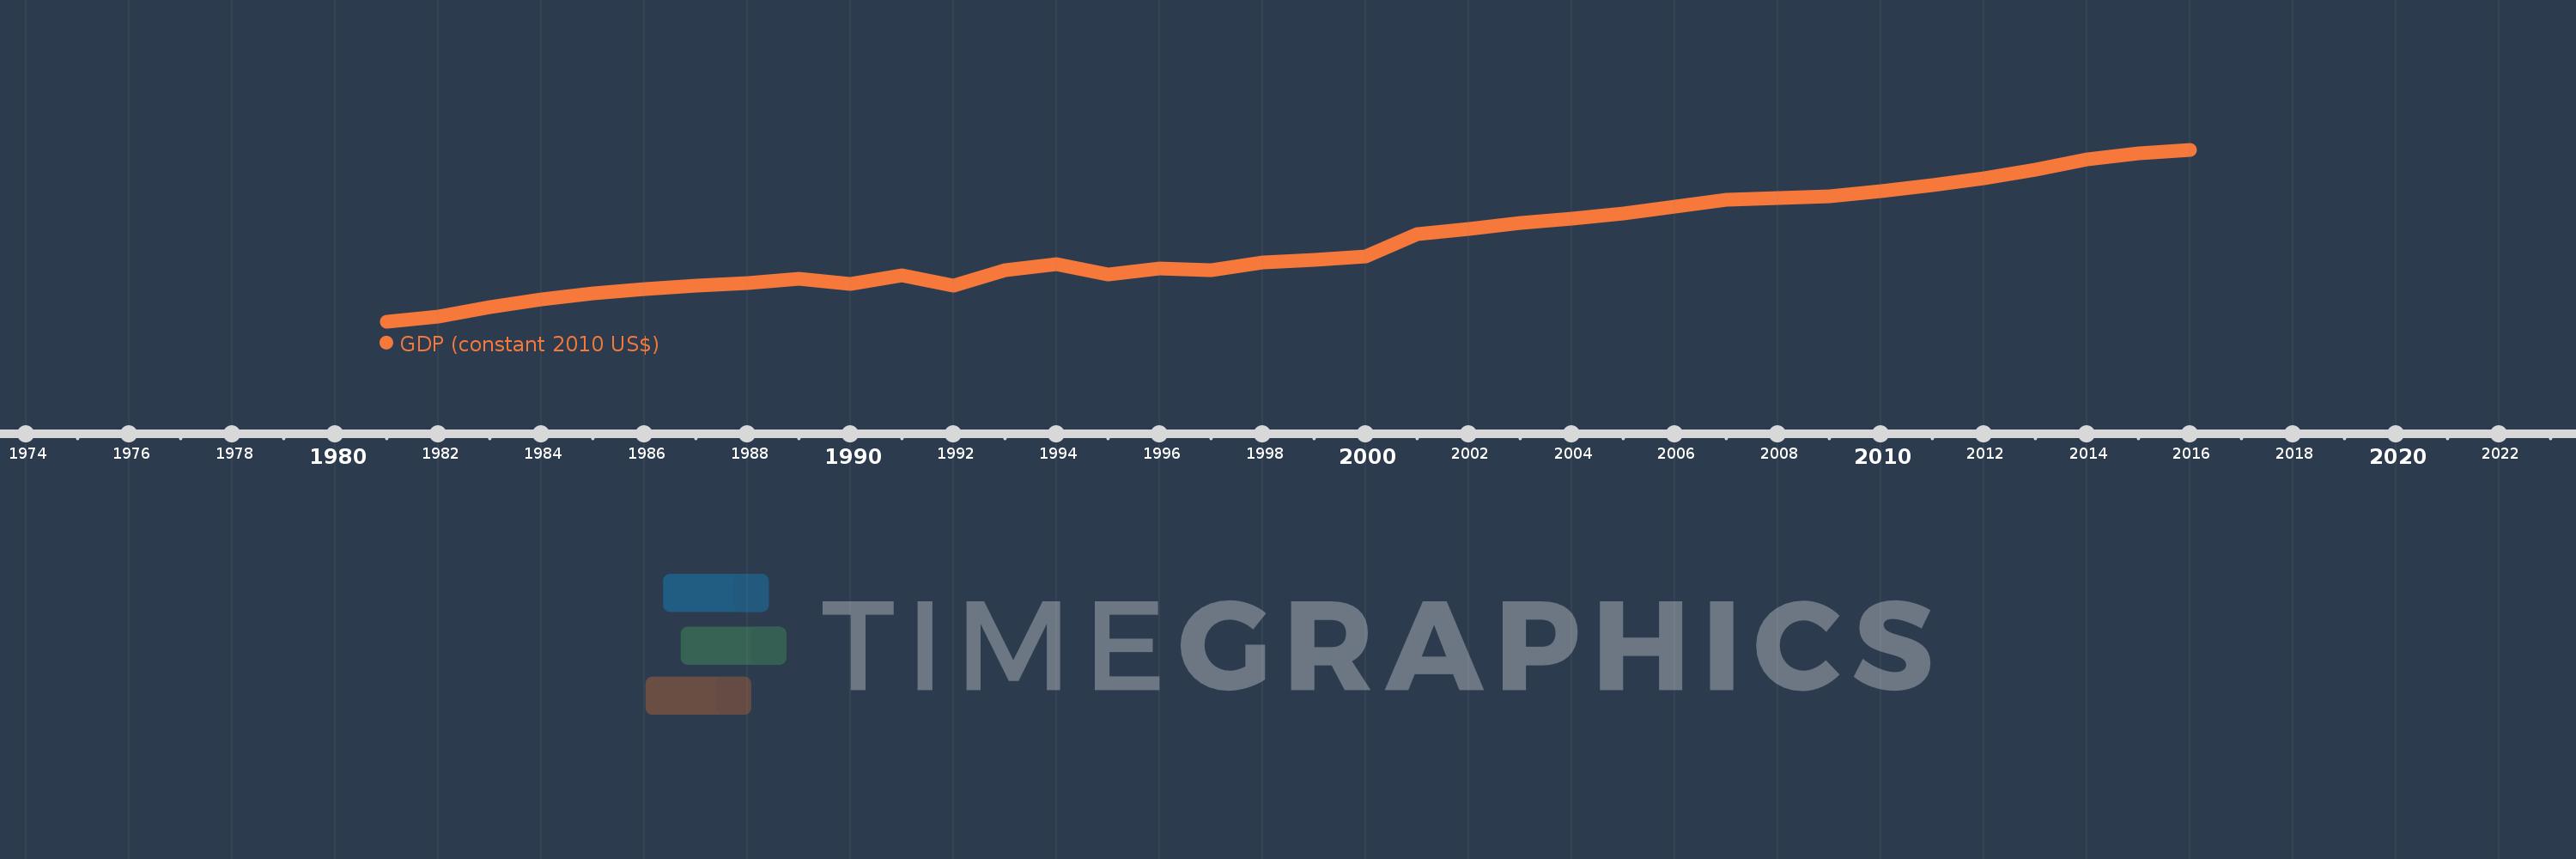
GDP (constant 2010 US$)
2016,2015,2014,2013,2012,2011,2010,2009,2008,2007,2006,2005,2004,2003,2002,2001,2000,1999,1998,1997,1996,1995,1994,1993,1992,1991,1990,1989,1988,1987,1986,1985,1984,1983,1982,1981
Cette statistique dans les autres pays:
AfghanistanAlbaniaAlgeriaAndorraAngolaAntigua and BarbudaArab WorldArgentinaArmeniaArubaAustraliaAustriaAzerbaijanBahamas, TheBahrainBangladeshBarbadosBelarusBelgiumBelizeBeninBermudaBhutanBoliviaBosnia and HerzegovinaBotswanaBrazilBrunei DarussalamBulgariaBurkina FasoBurundiCabo VerdeCambodiaCameroonCanadaCaribbean small statesCentral African RepublicCentral Europe and the BalticsChadChileChinaColombiaComorosCongo, Dem. Rep.Congo, Rep.Costa RicaCote d'IvoireCroatiaCubaCyprusCzech RepublicDenmarkDjiboutiDominicaDominican RepublicEarly-demographic dividendEast Asia & PacificEast Asia & Pacific (excluding high income)East Asia & Pacific (IDA & IBRD countries)EcuadorEgypt, Arab Rep.El SalvadorEquatorial GuineaEritreaEstoniaEthiopiaEuro areaEurope & Central AsiaEurope & Central Asia (excluding high income)Europe & Central Asia (IDA & IBRD countries)European UnionFaroe IslandsFijiFinlandFragile and conflict affected situationsFranceGabonGambia, TheGeorgiaGermanyGhanaGreeceGreenlandGrenadaGuatemalaGuineaGuinea-BissauGuyanaHaitiHeavily indebted poor countries (HIPC)High incomeHondurasHong Kong SAR, ChinaHungaryIBRD onlyIcelandIDA & IBRD totalIDA blendIDA onlyIDA totalIndiaIndonesiaIran, Islamic Rep.IraqIrelandIsle of ManIsraelItalyJamaicaJapanJordanKazakhstanKenyaKiribatiKorea, Rep.KosovoKuwaitKyrgyz RepublicLao PDRLate-demographic dividendLatin America & Caribbean Latin America & Caribbean (excluding high income)Latin America & the Caribbean (IDA & IBRD countries)LatviaLeast developed countries: UN classificationLebanonLesothoLiberiaLibyaLiechtensteinLithuaniaLow & middle incomeLow incomeLower middle incomeLuxembourgMacao SAR, ChinaMacedonia, FYRMadagascarMalawiMalaysiaMaldivesMaliMaltaMarshall IslandsMauritaniaMauritiusMexicoMicronesia, Fed. Sts.Middle East & North AfricaMiddle East & North Africa (excluding high income)Middle East & North Africa (IDA & IBRD countries)Middle incomeMoldovaMonacoMongoliaMontenegroMoroccoMozambiqueMyanmarNamibiaNauruNepalNetherlandsNew ZealandNicaraguaNigerNigeriaNorth AmericaNorwayOECD membersOmanOther small statesPacific island small statesPakistanPalauPanamaPapua New GuineaParaguayPeruPhilippinesPolandPortugalPost-demographic dividendPre-demographic dividendPuerto RicoQatarRomaniaRussian FederationRwandaSamoaSao Tome and PrincipeSaudi ArabiaSenegalSerbiaSeychellesSierra LeoneSingaporeSlovak RepublicSloveniaSmall statesSolomon IslandsSouth AfricaSouth AsiaSouth Asia (IDA & IBRD)South SudanSpainSri LankaSt. Kitts and NevisSt. LuciaSt. Vincent and the GrenadinesSub-Saharan Africa Sub-Saharan Africa (excluding high income)Sub-Saharan Africa (IDA & IBRD countries)SudanSurinameSwazilandSwedenSwitzerlandTajikistanTanzaniaThailandTimor-LesteTogoTongaTrinidad and TobagoTunisiaTurkeyTurkmenistanTuvaluUgandaUkraineUnited Arab EmiratesUnited KingdomUnited StatesUpper middle incomeUruguayUzbekistanVanuatuVenezuela, RBVietnamWest Bank and GazaWorldYemen, Rep.ZambiaZimbabwe La ligne de temps
Cette échelle de temps montre un graphique de 1981 année à 2016 année Comoros. Les données jusqu'à 1980 année ne sont pas présentés. Quantité d'observations actuelles selon dates: 36.
Source (désignation):
Les indicateurs du développement mondiale
Source (organisation):
World Bank national accounts data, and OECD National Accounts data files.
Catégories:
Economy & Growth
Dernière mise à jour
23 avr. 2017
Les indicateurs de changement de valeurs selon les années
Minimum:
268.779 mln.
1 janv. 1981
Maximum:
598.21 mln.
1 janv. 2016
Pour la date d''observation
Valeur
Changement absolu
Le changement par rapport à la valeur précédente
1 janv. 1981
268.779 mln.
+268.779 mln.
0.0%
1 janv. 1982
279.168 mln.
+10.388 mln.
3.86%
1 janv. 1983
296.989 mln.
+17.821 mln.
6.38%
1 janv. 1984
311.306 mln.
+14.318 mln.
4.82%
1 janv. 1985
324.102 mln.
+12.796 mln.
4.11%
1 janv. 1986
331.493 mln.
+7.391 mln.
2.28%
1 janv. 1987
337.682 mln.
+6.19 mln.
1.87%
1 janv. 1988
343.214 mln.
+5.531 mln.
1.64%
1 janv. 1989
352.438 mln.
+9.224 mln.
2.69%
1 janv. 1990
341.228 mln.
-11.21 mln.
-3.18%
1 janv. 1991
358.601 mln.
+17.373 mln.
5.09%
1 janv. 1992
339.252 mln.
-19.349 mln.
-5.4%
1 janv. 1993
368.194 mln.
+28.941 mln.
8.53%
1 janv. 1994
379.261 mln.
+11.068 mln.
3.01%
1 janv. 1995
359.249 mln.
-20.012 mln.
-5.28%
1 janv. 1996
372.218 mln.
+12.969 mln.
3.61%
1 janv. 1997
367.41 mln.
-4.808 mln.
-1.29%
1 janv. 1998
382.218 mln.
+14.808 mln.
4.03%
1 janv. 1999
387.121 mln.
+4.903 mln.
1.28%
1 janv. 2000
394.569 mln.
+7.449 mln.
1.92%
1 janv. 2001
437.373 mln.
+42.803 mln.
10.85%
1 janv. 2002
447.576 mln.
+10.204 mln.
2.33%
1 janv. 2003
457.981 mln.
+10.405 mln.
2.32%
1 janv. 2004
467.618 mln.
+9.636 mln.
2.1%
1 janv. 2005
476.594 mln.
+8.976 mln.
1.92%
1 janv. 2006
490.117 mln.
+13.523 mln.
2.84%
1 janv. 2007
503.09 mln.
+12.973 mln.
2.65%
1 janv. 2008
507.116 mln.
+4.025 mln.
0.8%
1 janv. 2009
509.145 mln.
+2.03 mln.
0.4%
1 janv. 2010
519.074 mln.
+9.928 mln.
1.95%
1 janv. 2011
530.493 mln.
+11.42 mln.
2.2%
1 janv. 2012
544.286 mln.
+13.793 mln.
2.6%
1 janv. 2013
560.615 mln.
+16.329 mln.
3.0%
1 janv. 2014
580.236 mln.
+19.622 mln.
3.5%
1 janv. 2015
592.199 mln.
+11.962 mln.
2.06%
1 janv. 2016
598.21 mln.
+6.012 mln.
1.02%
Classement des pays selon les statistiques actuelles par années


Commentaires: