29
/fr/
fr
AIzaSyAYiBZKx7MnpbEhh9jyipgxe19OcubqV5w
April 1, 2024
99848
Cameroon
CMR
true
2
1
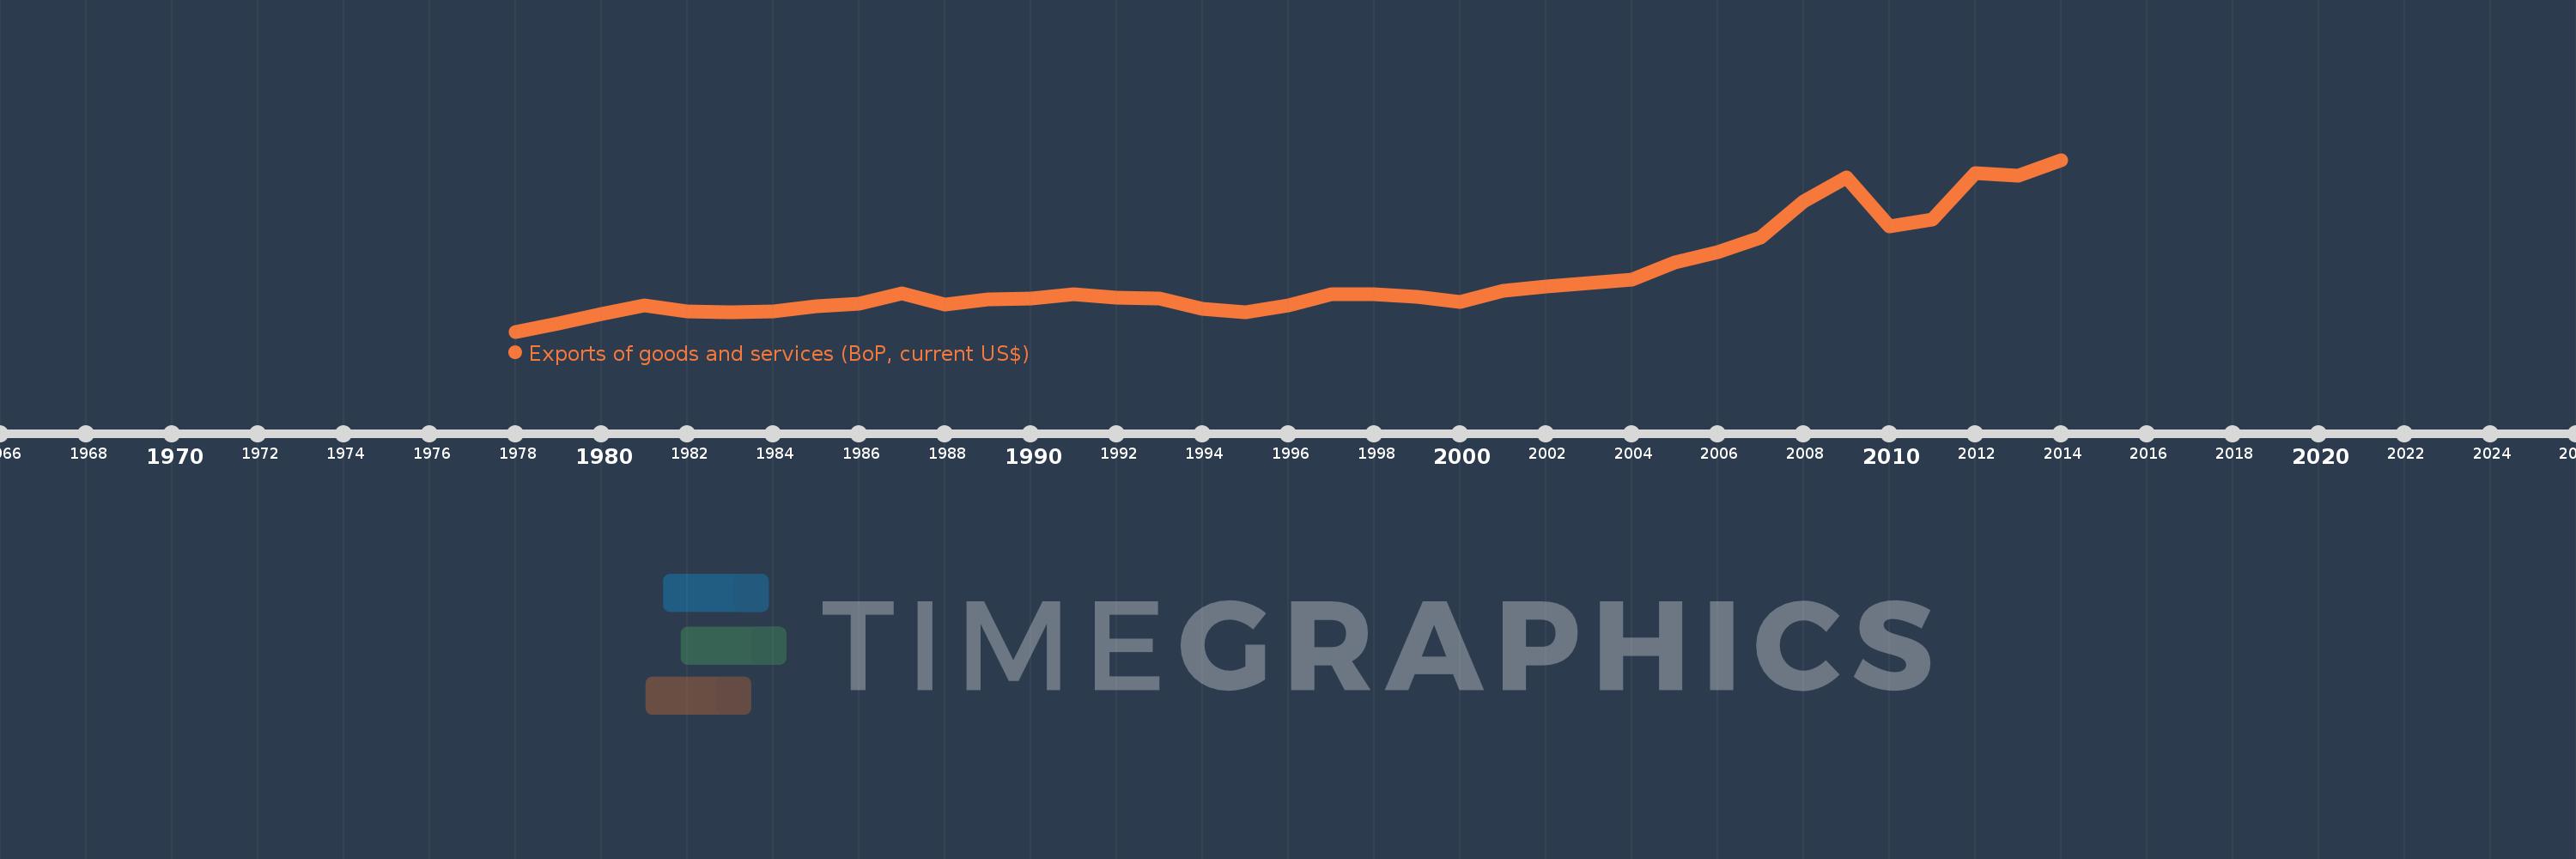
Exports of goods and services (BoP, current US$)
2014,2013,2012,2011,2010,2009,2008,2007,2006,2005,2004,2003,2002,2001,2000,1999,1998,1997,1996,1995,1994,1993,1992,1991,1990,1989,1988,1987,1986,1985,1984,1983,1982,1981,1980,1979,1978
Cette statistique dans les autres pays:
AfghanistanAlbaniaAlgeriaAngolaAntigua and BarbudaArab WorldArgentinaArmeniaArubaAustraliaAustriaAzerbaijanBahamas, TheBahrainBangladeshBarbadosBelarusBelgiumBelizeBeninBermudaBhutanBoliviaBosnia and HerzegovinaBotswanaBrazilBrunei DarussalamBulgariaBurkina FasoBurundiCabo VerdeCambodiaCameroonCanadaCaribbean small statesCentral African RepublicCentral Europe and the BalticsChadChileChinaColombiaComorosCongo, Dem. Rep.Congo, Rep.Costa RicaCote d'IvoireCroatiaCuracaoCyprusCzech RepublicDenmarkDjiboutiDominicaDominican RepublicEarly-demographic dividendEast Asia & PacificEast Asia & Pacific (excluding high income)East Asia & Pacific (IDA & IBRD countries)EcuadorEgypt, Arab Rep.El SalvadorEquatorial GuineaEritreaEstoniaEthiopiaEuro areaEurope & Central AsiaEurope & Central Asia (excluding high income)Europe & Central Asia (IDA & IBRD countries)European UnionFaroe IslandsFijiFinlandFragile and conflict affected situationsFranceFrench PolynesiaGabonGambia, TheGeorgiaGermanyGhanaGreeceGrenadaGuatemalaGuineaGuinea-BissauGuyanaHaitiHeavily indebted poor countries (HIPC)High incomeHondurasHong Kong SAR, ChinaHungaryIBRD onlyIcelandIDA & IBRD totalIDA blendIDA onlyIDA totalIndiaIndonesiaIran, Islamic Rep.IraqIrelandIsraelItalyJamaicaJapanJordanKazakhstanKenyaKiribatiKorea, Rep.KosovoKuwaitKyrgyz RepublicLao PDRLate-demographic dividendLatin America & Caribbean Latin America & Caribbean (excluding high income)Latin America & the Caribbean (IDA & IBRD countries)LatviaLeast developed countries: UN classificationLebanonLesothoLiberiaLibyaLithuaniaLow & middle incomeLow incomeLower middle incomeLuxembourgMacao SAR, ChinaMacedonia, FYRMadagascarMalawiMalaysiaMaldivesMaliMaltaMarshall IslandsMauritaniaMauritiusMexicoMicronesia, Fed. Sts.Middle East & North Africa (excluding high income)Middle East & North Africa (IDA & IBRD countries)Middle incomeMoldovaMongoliaMontenegroMoroccoMozambiqueMyanmarNamibiaNepalNetherlandsNew CaledoniaNicaraguaNigerNigeriaNorth AmericaNorwayOECD membersOmanPacific island small statesPakistanPalauPanamaPapua New GuineaParaguayPeruPhilippinesPolandPortugalPost-demographic dividendPre-demographic dividendQatarRomaniaRussian FederationRwandaSamoaSao Tome and PrincipeSaudi ArabiaSenegalSerbiaSeychellesSierra LeoneSingaporeSint Maarten (Dutch part)Slovak RepublicSloveniaSolomon IslandsSouth AfricaSouth AsiaSouth Asia (IDA & IBRD)South SudanSpainSri LankaSt. Kitts and NevisSt. LuciaSt. Vincent and the GrenadinesSub-Saharan Africa Sub-Saharan Africa (excluding high income)Sub-Saharan Africa (IDA & IBRD countries)SudanSurinameSwazilandSwedenSwitzerlandSyrian Arab RepublicTajikistanTanzaniaThailandTimor-LesteTogoTongaTrinidad and TobagoTunisiaTurkeyTuvaluUgandaUkraineUnited KingdomUnited StatesUpper middle incomeUruguayVanuatuVenezuela, RBVietnamWest Bank and GazaWorldYemen, Rep.ZambiaZimbabwe La ligne de temps
Cette échelle de temps montre un graphique de 1978 année à 2014 année Cameroon. Les données jusqu'à 1977 année ne sont pas présentés. Quantité d'observations actuelles selon dates: 37.
Source (désignation):
Les indicateurs du développement mondiale
Source (organisation):
International Monetary Fund, Balance of Payments Statistics Yearbook and data files.
Catégories:
Economy & Growth, Trade
Dernière mise à jour
23 avr. 2017
Les indicateurs de changement de valeurs selon les années
Minimum:
970.858 mln.
1 janv. 1978
Maximum:
8.058 mds
1 janv. 2014
Pour la date d''observation
Valeur
Changement absolu
Le changement par rapport à la valeur précédente
1 janv. 1978
970.858 mln.
+970.858 mln.
0.0%
1 janv. 1979
1.302 mds
+331.435 mln.
34.14%
1 janv. 1980
1.706 mds
+403.316 mln.
30.97%
1 janv. 1981
2.058 mds
+352.848 mln.
20.69%
1 janv. 1982
1.8 mds
-258.335 mln.
-12.55%
1 janv. 1983
1.785 mds
-14.916 mln.
-0.83%
1 janv. 1984
1.807 mds
+22.249 mln.
1.25%
1 janv. 1985
2.004 mds
+196.153 mln.
10.85%
1 janv. 1986
2.125 mds
+121.406 mln.
6.06%
1 janv. 1987
2.544 mds
+419.124 mln.
19.72%
1 janv. 1988
2.1 mds
-444.094 mln.
-17.46%
1 janv. 1989
2.3 mds
+200.087 mln.
9.53%
1 janv. 1990
2.33 mds
+29.401 mln.
1.28%
1 janv. 1991
2.508 mds
+177.99 mln.
7.64%
1 janv. 1992
2.363 mds
-144.092 mln.
-5.75%
1 janv. 1993
2.342 mds
-21.915 mln.
-0.93%
1 janv. 1994
1.899 mds
-442.854 mln.
-18.91%
1 janv. 1995
1.785 mds
-113.663 mln.
-5.99%
1 janv. 1996
2.04 mds
+255.296 mln.
14.3%
1 janv. 1997
2.498 mds
+457.363 mln.
22.42%
1 janv. 1998
2.495 mds
-2.7 mln.
-0.11%
1 janv. 1999
2.407 mds
-87.666 mln.
-3.51%
1 janv. 2000
2.178 mds
-229.516 mln.
-9.53%
1 janv. 2001
2.667 mds
+488.954 mln.
22.45%
1 janv. 2002
2.823 mds
+155.991 mln.
5.85%
1 janv. 2003
2.984 mds
+161.767 mln.
5.73%
1 janv. 2004
3.128 mds
+143.551 mln.
4.81%
1 janv. 2005
3.817 mds
+688.96 mln.
22.03%
1 janv. 2006
4.235 mds
+418.156 mln.
10.96%
1 janv. 2007
4.865 mds
+630.021 mln.
14.88%
1 janv. 2008
6.326 mds
+1.461 mds
30.03%
1 janv. 2009
7.325 mds
+999.258 mln.
15.8%
1 janv. 2010
5.313 mds
-2.012 mds
-27.47%
1 janv. 2011
5.608 mds
+294.612 mln.
5.54%
1 janv. 2012
7.511 mds
+1.903 mds
33.94%
1 janv. 2013
7.385 mds
-125.688 mln.
-1.67%
1 janv. 2014
8.058 mds
+673.084 mln.
9.11%
Classement des pays selon les statistiques actuelles par années


Commentaires: