29
/fr/
fr
AIzaSyAYiBZKx7MnpbEhh9jyipgxe19OcubqV5w
April 1, 2024
201497
Morocco
MAR
true
2
1
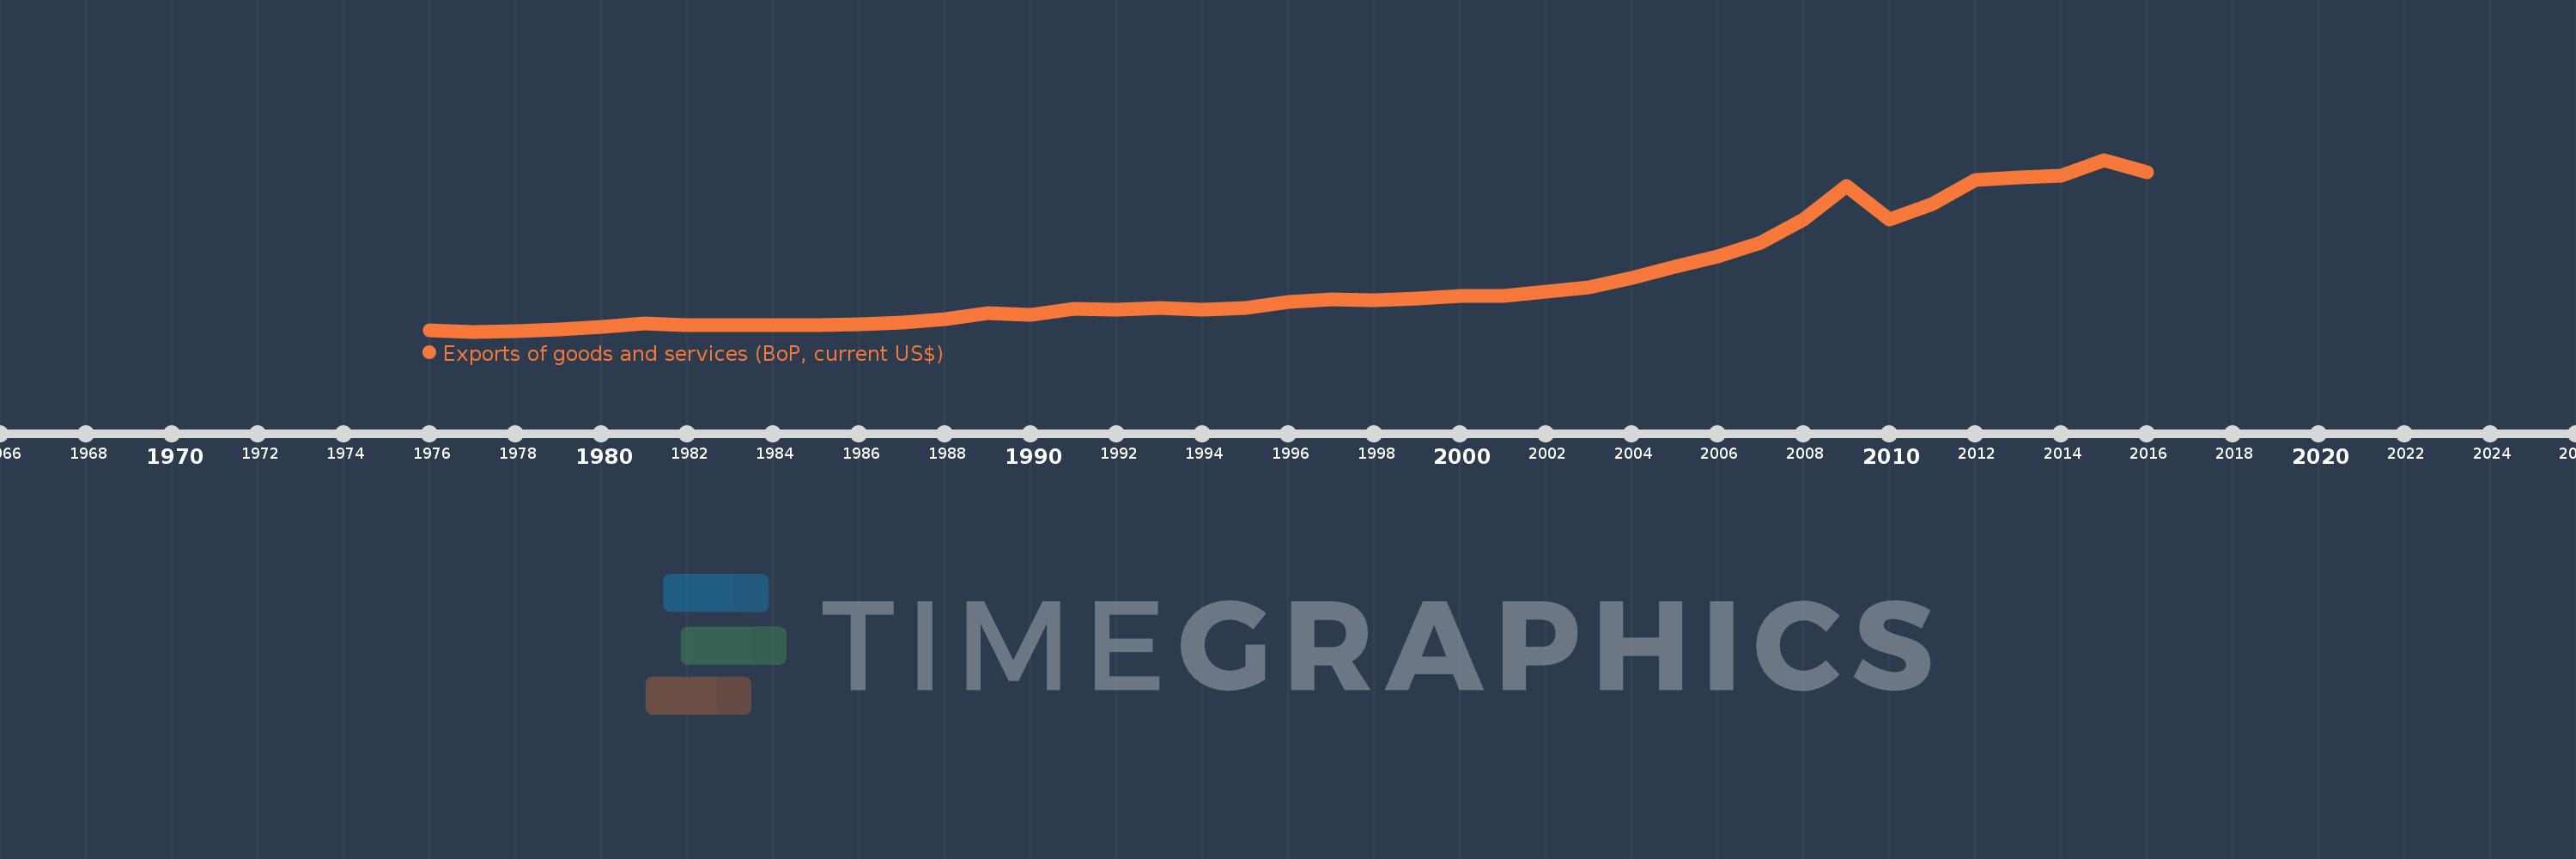
Exports of goods and services (BoP, current US$)
2016,2015,2014,2013,2012,2011,2010,2009,2008,2007,2006,2005,2004,2003,2002,2001,2000,1999,1998,1997,1996,1995,1994,1993,1992,1991,1990,1989,1988,1987,1986,1985,1984,1983,1982,1981,1980,1979,1978,1977,1976
Cette statistique dans les autres pays:
AfghanistanAlbaniaAlgeriaAngolaAntigua and BarbudaArab WorldArgentinaArmeniaArubaAustraliaAustriaAzerbaijanBahamas, TheBahrainBangladeshBarbadosBelarusBelgiumBelizeBeninBermudaBhutanBoliviaBosnia and HerzegovinaBotswanaBrazilBrunei DarussalamBulgariaBurkina FasoBurundiCabo VerdeCambodiaCameroonCanadaCaribbean small statesCentral African RepublicCentral Europe and the BalticsChadChileChinaColombiaComorosCongo, Dem. Rep.Congo, Rep.Costa RicaCote d'IvoireCroatiaCuracaoCyprusCzech RepublicDenmarkDjiboutiDominicaDominican RepublicEarly-demographic dividendEast Asia & PacificEast Asia & Pacific (excluding high income)East Asia & Pacific (IDA & IBRD countries)EcuadorEgypt, Arab Rep.El SalvadorEquatorial GuineaEritreaEstoniaEthiopiaEuro areaEurope & Central AsiaEurope & Central Asia (excluding high income)Europe & Central Asia (IDA & IBRD countries)European UnionFaroe IslandsFijiFinlandFragile and conflict affected situationsFranceFrench PolynesiaGabonGambia, TheGeorgiaGermanyGhanaGreeceGrenadaGuatemalaGuineaGuinea-BissauGuyanaHaitiHeavily indebted poor countries (HIPC)High incomeHondurasHong Kong SAR, ChinaHungaryIBRD onlyIcelandIDA & IBRD totalIDA blendIDA onlyIDA totalIndiaIndonesiaIran, Islamic Rep.IraqIrelandIsraelItalyJamaicaJapanJordanKazakhstanKenyaKiribatiKorea, Rep.KosovoKuwaitKyrgyz RepublicLao PDRLate-demographic dividendLatin America & Caribbean Latin America & Caribbean (excluding high income)Latin America & the Caribbean (IDA & IBRD countries)LatviaLeast developed countries: UN classificationLebanonLesothoLiberiaLibyaLithuaniaLow & middle incomeLow incomeLower middle incomeLuxembourgMacao SAR, ChinaMacedonia, FYRMadagascarMalawiMalaysiaMaldivesMaliMaltaMarshall IslandsMauritaniaMauritiusMexicoMicronesia, Fed. Sts.Middle East & North Africa (excluding high income)Middle East & North Africa (IDA & IBRD countries)Middle incomeMoldovaMongoliaMontenegroMoroccoMozambiqueMyanmarNamibiaNepalNetherlandsNew CaledoniaNicaraguaNigerNigeriaNorth AmericaNorwayOECD membersOmanPacific island small statesPakistanPalauPanamaPapua New GuineaParaguayPeruPhilippinesPolandPortugalPost-demographic dividendPre-demographic dividendQatarRomaniaRussian FederationRwandaSamoaSao Tome and PrincipeSaudi ArabiaSenegalSerbiaSeychellesSierra LeoneSingaporeSint Maarten (Dutch part)Slovak RepublicSloveniaSolomon IslandsSouth AfricaSouth AsiaSouth Asia (IDA & IBRD)South SudanSpainSri LankaSt. Kitts and NevisSt. LuciaSt. Vincent and the GrenadinesSub-Saharan Africa Sub-Saharan Africa (excluding high income)Sub-Saharan Africa (IDA & IBRD countries)SudanSurinameSwazilandSwedenSwitzerlandSyrian Arab RepublicTajikistanTanzaniaThailandTimor-LesteTogoTongaTrinidad and TobagoTunisiaTurkeyTuvaluUgandaUkraineUnited KingdomUnited StatesUpper middle incomeUruguayVanuatuVenezuela, RBVietnamWest Bank and GazaWorldYemen, Rep.ZambiaZimbabwe La ligne de temps
Cette échelle de temps montre un graphique de 1976 année à 2016 année Morocco. Les données jusqu'à 1975 année ne sont pas présentés. Quantité d'observations actuelles selon dates: 41.
Source (désignation):
Les indicateurs du développement mondiale
Source (organisation):
International Monetary Fund, Balance of Payments Statistics Yearbook and data files.
Catégories:
Economy & Growth, Trade
Dernière mise à jour
23 avr. 2017
Les indicateurs de changement de valeurs selon les années
Minimum:
1.696 mds
1 janv. 1977
Maximum:
35.827 mds
1 janv. 2015
Pour la date d''observation
Valeur
Changement absolu
Le changement par rapport à la valeur précédente
1 janv. 1976
1.998 mds
+1.998 mds
0.0%
1 janv. 1977
1.696 mds
-302.026 mln.
-15.11%
1 janv. 1978
1.84 mds
+143.622 mln.
8.47%
1 janv. 1979
2.138 mds
+298.199 mln.
16.21%
1 janv. 1980
2.672 mds
+534.065 mln.
24.98%
1 janv. 1981
3.233 mds
+560.483 mln.
20.97%
1 janv. 1982
3.048 mds
-185.203 mln.
-5.73%
1 janv. 1983
2.919 mds
-128.284 mln.
-4.21%
1 janv. 1984
2.92 mds
+1.114 mln.
0.04%
1 janv. 1985
3.0 mds
+79.216 mln.
2.71%
1 janv. 1986
3.145 mds
+145.185 mln.
4.84%
1 janv. 1987
3.561 mds
+416.122 mln.
13.23%
1 janv. 1988
4.177 mds
+616.246 mln.
17.31%
1 janv. 1989
5.388 mds
+1.21 mds
28.98%
1 janv. 1990
4.981 mds
-406.985 mln.
-7.55%
1 janv. 1991
6.239 mds
+1.258 mds
25.26%
1 janv. 1992
6.117 mds
-121.21 mln.
-1.94%
1 janv. 1993
6.377 mds
+259.765 mln.
4.25%
1 janv. 1994
6.067 mds
-309.82 mln.
-4.86%
1 janv. 1995
6.458 mds
+390.909 mln.
6.44%
1 janv. 1996
7.566 mds
+1.108 mds
17.15%
1 janv. 1997
8.178 mds
+611.883 mln.
8.09%
1 janv. 1998
7.863 mds
-314.913 mln.
-3.85%
1 janv. 1999
8.28 mds
+417.008 mln.
5.3%
1 janv. 2000
8.818 mds
+537.509 mln.
6.49%
1 janv. 2001
8.851 mds
+33.332 mln.
0.38%
1 janv. 2002
9.548 mds
+696.777 mln.
7.87%
1 janv. 2003
10.523 mds
+974.965 mln.
10.21%
1 janv. 2004
12.334 mds
+1.811 mds
17.21%
1 janv. 2005
14.498 mds
+2.164 mds
17.55%
1 janv. 2006
16.592 mds
+2.094 mds
14.44%
1 janv. 2007
19.415 mds
+2.823 mds
17.01%
1 janv. 2008
23.95 mds
+4.534 mds
23.36%
1 janv. 2009
30.554 mds
+6.604 mds
27.58%
1 janv. 2010
23.999 mds
-6.555 mds
-21.45%
1 janv. 2011
27.045 mds
+3.047 mds
12.69%
1 janv. 2012
31.845 mds
+4.799 mds
17.75%
1 janv. 2013
32.339 mds
+493.812 mln.
1.55%
1 janv. 2014
32.614 mds
+275.781 mln.
0.85%
1 janv. 2015
35.827 mds
+3.213 mds
9.85%
1 janv. 2016
33.292 mds
-2.535 mds
-7.08%
Classement des pays selon les statistiques actuelles par années


Commentaires: