29
/fr/
fr
AIzaSyAYiBZKx7MnpbEhh9jyipgxe19OcubqV5w
April 1, 2024
123422
Ecuador
ECU
true
2
1
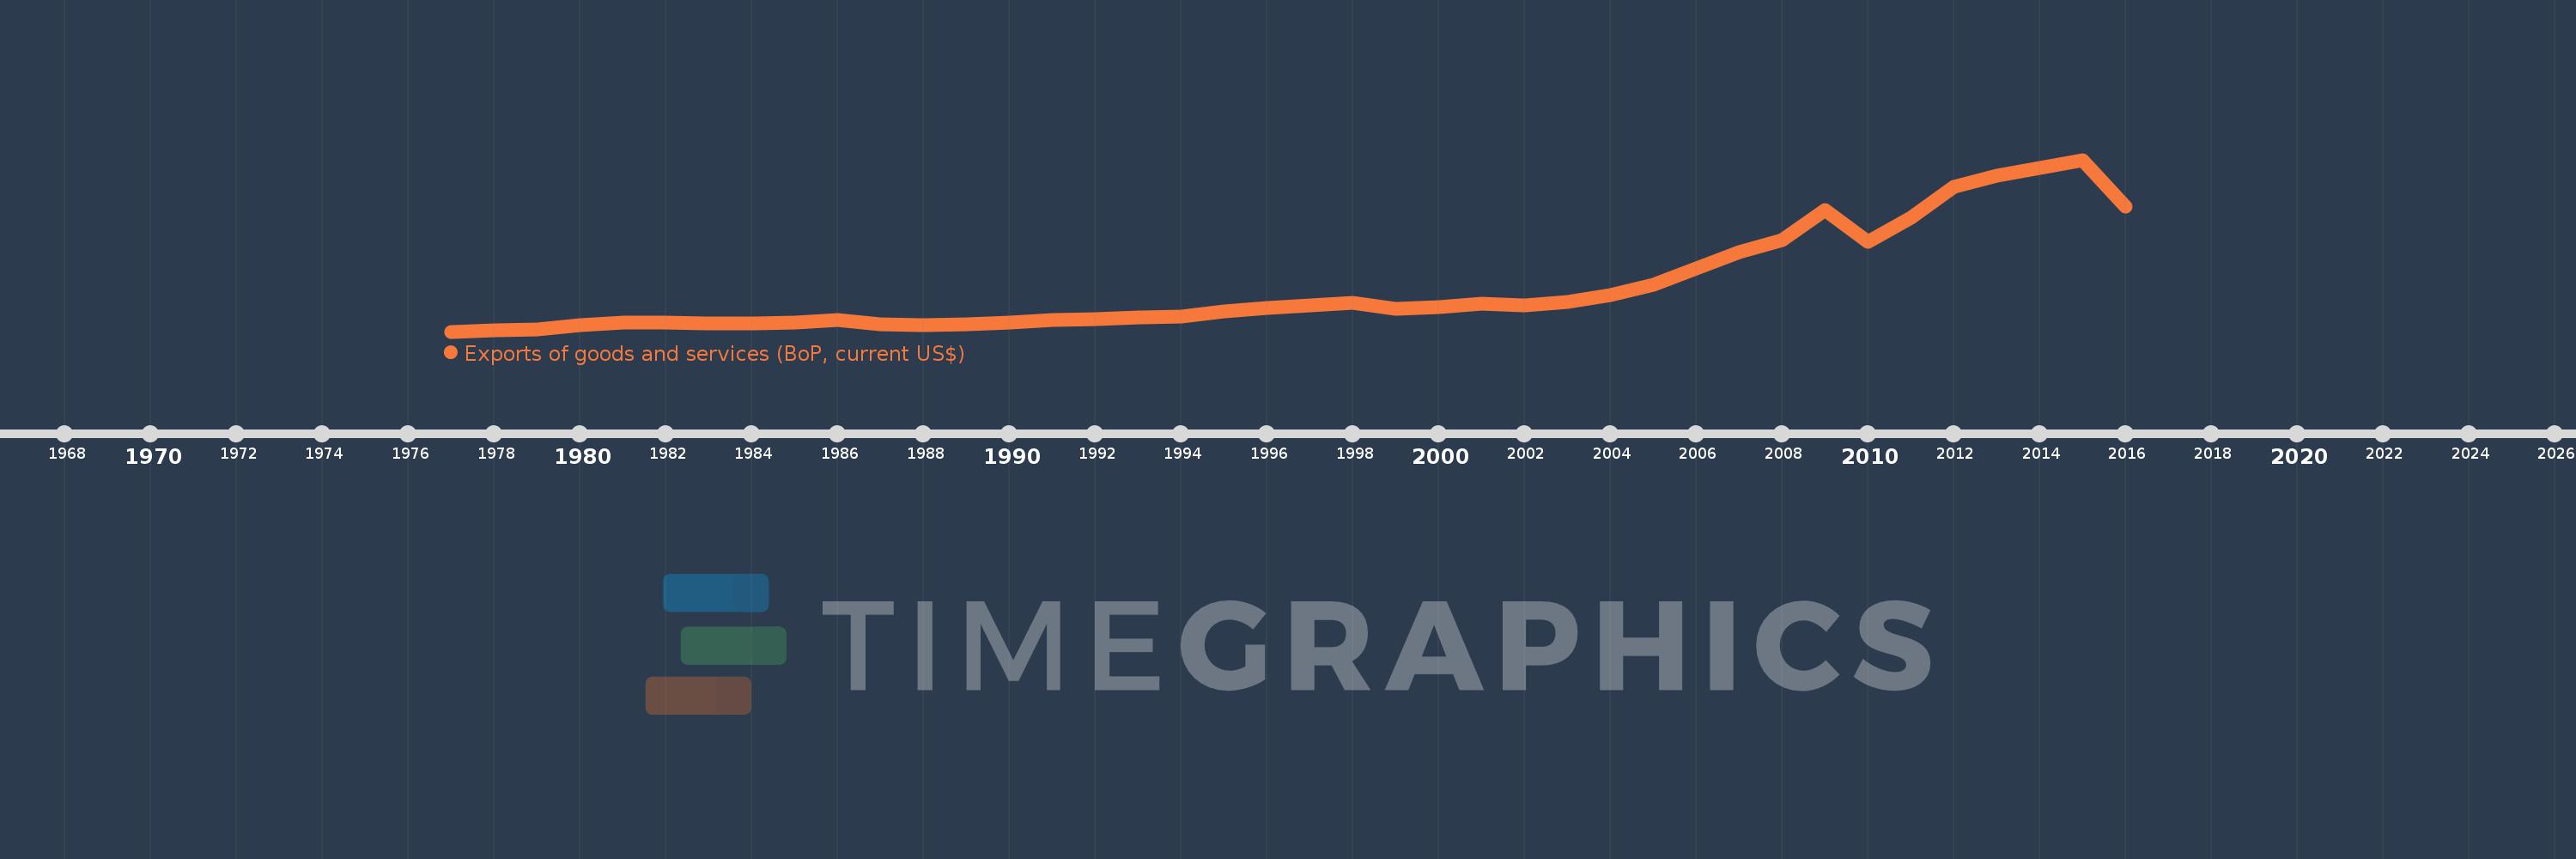
Exports of goods and services (BoP, current US$)
2016,2015,2014,2013,2012,2011,2010,2009,2008,2007,2006,2005,2004,2003,2002,2001,2000,1999,1998,1997,1996,1995,1994,1993,1992,1991,1990,1989,1988,1987,1986,1985,1984,1983,1982,1981,1980,1979,1978,1977
Cette statistique dans les autres pays:
AfghanistanAlbaniaAlgeriaAngolaAntigua and BarbudaArab WorldArgentinaArmeniaArubaAustraliaAustriaAzerbaijanBahamas, TheBahrainBangladeshBarbadosBelarusBelgiumBelizeBeninBermudaBhutanBoliviaBosnia and HerzegovinaBotswanaBrazilBrunei DarussalamBulgariaBurkina FasoBurundiCabo VerdeCambodiaCameroonCanadaCaribbean small statesCentral African RepublicCentral Europe and the BalticsChadChileChinaColombiaComorosCongo, Dem. Rep.Congo, Rep.Costa RicaCote d'IvoireCroatiaCuracaoCyprusCzech RepublicDenmarkDjiboutiDominicaDominican RepublicEarly-demographic dividendEast Asia & PacificEast Asia & Pacific (excluding high income)East Asia & Pacific (IDA & IBRD countries)EcuadorEgypt, Arab Rep.El SalvadorEquatorial GuineaEritreaEstoniaEthiopiaEuro areaEurope & Central AsiaEurope & Central Asia (excluding high income)Europe & Central Asia (IDA & IBRD countries)European UnionFaroe IslandsFijiFinlandFragile and conflict affected situationsFranceFrench PolynesiaGabonGambia, TheGeorgiaGermanyGhanaGreeceGrenadaGuatemalaGuineaGuinea-BissauGuyanaHaitiHeavily indebted poor countries (HIPC)High incomeHondurasHong Kong SAR, ChinaHungaryIBRD onlyIcelandIDA & IBRD totalIDA blendIDA onlyIDA totalIndiaIndonesiaIran, Islamic Rep.IraqIrelandIsraelItalyJamaicaJapanJordanKazakhstanKenyaKiribatiKorea, Rep.KosovoKuwaitKyrgyz RepublicLao PDRLate-demographic dividendLatin America & Caribbean Latin America & Caribbean (excluding high income)Latin America & the Caribbean (IDA & IBRD countries)LatviaLeast developed countries: UN classificationLebanonLesothoLiberiaLibyaLithuaniaLow & middle incomeLow incomeLower middle incomeLuxembourgMacao SAR, ChinaMacedonia, FYRMadagascarMalawiMalaysiaMaldivesMaliMaltaMarshall IslandsMauritaniaMauritiusMexicoMicronesia, Fed. Sts.Middle East & North Africa (excluding high income)Middle East & North Africa (IDA & IBRD countries)Middle incomeMoldovaMongoliaMontenegroMoroccoMozambiqueMyanmarNamibiaNepalNetherlandsNew CaledoniaNicaraguaNigerNigeriaNorth AmericaNorwayOECD membersOmanPacific island small statesPakistanPalauPanamaPapua New GuineaParaguayPeruPhilippinesPolandPortugalPost-demographic dividendPre-demographic dividendQatarRomaniaRussian FederationRwandaSamoaSao Tome and PrincipeSaudi ArabiaSenegalSerbiaSeychellesSierra LeoneSingaporeSint Maarten (Dutch part)Slovak RepublicSloveniaSolomon IslandsSouth AfricaSouth AsiaSouth Asia (IDA & IBRD)South SudanSpainSri LankaSt. Kitts and NevisSt. LuciaSt. Vincent and the GrenadinesSub-Saharan Africa Sub-Saharan Africa (excluding high income)Sub-Saharan Africa (IDA & IBRD countries)SudanSurinameSwazilandSwedenSwitzerlandSyrian Arab RepublicTajikistanTanzaniaThailandTimor-LesteTogoTongaTrinidad and TobagoTunisiaTurkeyTuvaluUgandaUkraineUnited KingdomUnited StatesUpper middle incomeUruguayVanuatuVenezuela, RBVietnamWest Bank and GazaWorldYemen, Rep.ZambiaZimbabwe La ligne de temps
Cette échelle de temps montre un graphique de 1977 année à 2016 année Ecuador. Les données jusqu'à 1976 année ne sont pas présentés. Quantité d'observations actuelles selon dates: 40.
Source (désignation):
Les indicateurs du développement mondiale
Source (organisation):
International Monetary Fund, Balance of Payments Statistics Yearbook and data files.
Catégories:
Economy & Growth, Trade
Dernière mise à jour
23 avr. 2017
Les indicateurs de changement de valeurs selon les années
Minimum:
1.419 mds
1 janv. 1977
Maximum:
28.935 mds
1 janv. 2015
Pour la date d''observation
Valeur
Changement absolu
Le changement par rapport à la valeur précédente
1 janv. 1977
1.419 mds
+1.419 mds
0.0%
1 janv. 1978
1.603 mds
+184.1 mln.
12.98%
1 janv. 1979
1.704 mds
+100.8 mln.
6.29%
1 janv. 1980
2.411 mds
+707.2 mln.
41.51%
1 janv. 1981
2.887 mds
+476.3 mln.
19.76%
1 janv. 1982
2.926 mds
+38.6 mln.
1.34%
1 janv. 1983
2.708 mds
-217.6 mln.
-7.44%
1 janv. 1984
2.663 mds
-45.0 mln.
-1.66%
1 janv. 1985
2.912 mds
+249.0 mln.
9.35%
1 janv. 1986
3.302 mds
+390.0 mln.
13.39%
1 janv. 1987
2.641 mds
-661.0 mln.
-20.02%
1 janv. 1988
2.442 mds
-199.0 mln.
-7.54%
1 janv. 1989
2.645 mds
+203.0 mln.
8.31%
1 janv. 1990
2.87 mds
+225.0 mln.
8.51%
1 janv. 1991
3.262 mds
+392.0 mln.
13.66%
1 janv. 1992
3.407 mds
+145.0 mln.
4.45%
1 janv. 1993
3.718 mds
+311.0 mln.
9.13%
1 janv. 1994
3.772 mds
+53.55 mln.
1.44%
1 janv. 1995
4.612 mds
+840.19 mln.
22.28%
1 janv. 1996
5.196 mds
+584.39 mln.
12.67%
1 janv. 1997
5.612 mds
+416.32 mln.
8.01%
1 janv. 1998
6.047 mds
+434.08 mln.
7.73%
1 janv. 1999
5.004 mds
-1.042 mds
-17.23%
1 janv. 2000
5.345 mds
+340.54 mln.
6.8%
1 janv. 2001
5.906 mds
+560.998 mln.
10.5%
1 janv. 2002
5.683 mds
-222.535 mln.
-3.77%
1 janv. 2003
6.142 mds
+458.142 mln.
8.06%
1 janv. 2004
7.327 mds
+1.185 mds
19.3%
1 janv. 2005
8.982 mds
+1.655 mds
22.58%
1 janv. 2006
11.48 mds
+2.498 mds
27.81%
1 janv. 2007
14.213 mds
+2.733 mds
23.81%
1 janv. 2008
16.07 mds
+1.858 mds
13.07%
1 janv. 2009
20.902 mds
+4.832 mds
30.07%
1 janv. 2010
15.749 mds
-5.154 mds
-24.66%
1 janv. 2011
19.609 mds
+3.861 mds
24.52%
1 janv. 2012
24.67 mds
+5.06 mds
25.81%
1 janv. 2013
26.376 mds
+1.706 mds
6.92%
1 janv. 2014
27.625 mds
+1.249 mds
4.73%
1 janv. 2015
28.935 mds
+1.31 mds
4.74%
1 janv. 2016
21.4 mds
-7.536 mds
-26.04%
Classement des pays selon les statistiques actuelles par années


Commentaires: