29
/fr/
fr
AIzaSyAYiBZKx7MnpbEhh9jyipgxe19OcubqV5w
April 1, 2024
142928
Grenada
GRD
true
2
1
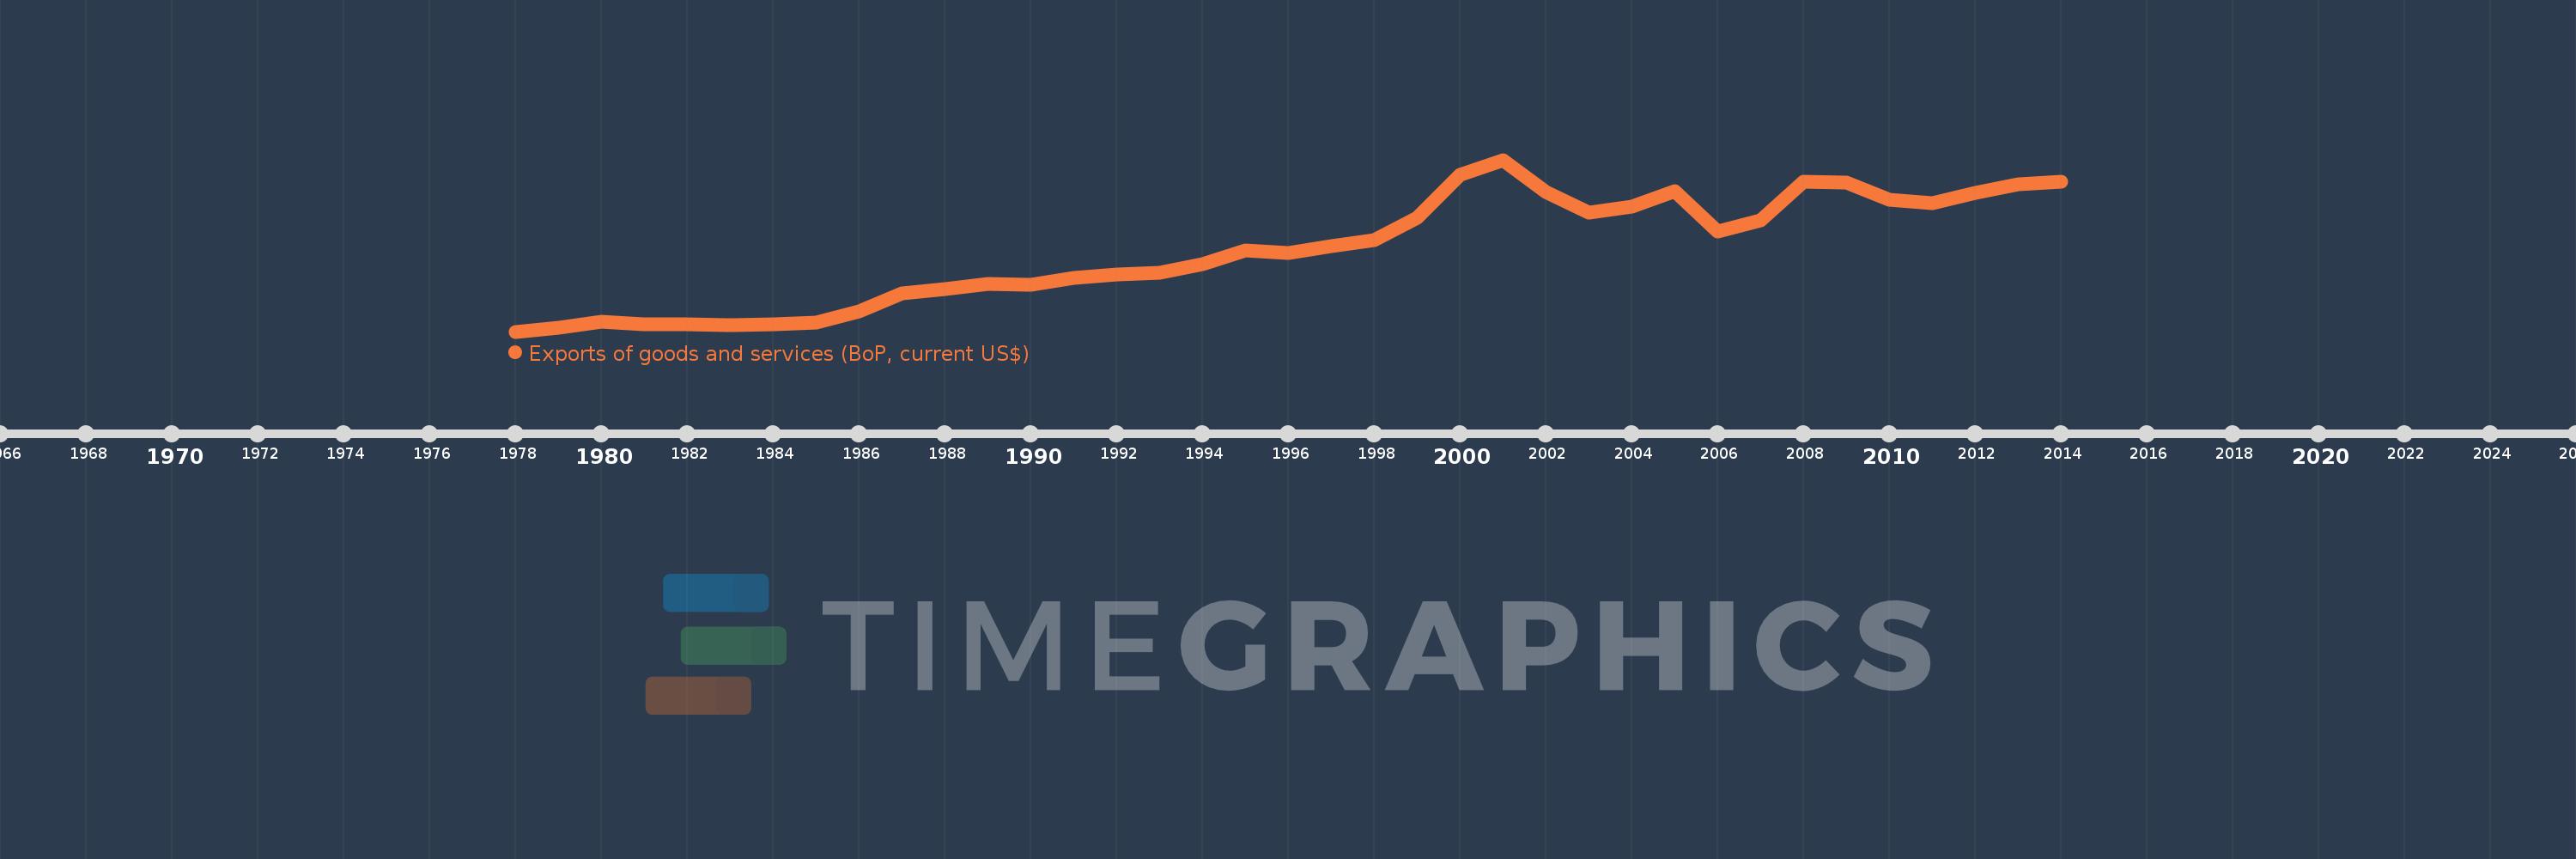
Exports of goods and services (BoP, current US$)
2014,2013,2012,2011,2010,2009,2008,2007,2006,2005,2004,2003,2002,2001,2000,1999,1998,1997,1996,1995,1994,1993,1992,1991,1990,1989,1988,1987,1986,1985,1984,1983,1982,1981,1980,1979,1978
Cette statistique dans les autres pays:
AfghanistanAlbaniaAlgeriaAngolaAntigua and BarbudaArab WorldArgentinaArmeniaArubaAustraliaAustriaAzerbaijanBahamas, TheBahrainBangladeshBarbadosBelarusBelgiumBelizeBeninBermudaBhutanBoliviaBosnia and HerzegovinaBotswanaBrazilBrunei DarussalamBulgariaBurkina FasoBurundiCabo VerdeCambodiaCameroonCanadaCaribbean small statesCentral African RepublicCentral Europe and the BalticsChadChileChinaColombiaComorosCongo, Dem. Rep.Congo, Rep.Costa RicaCote d'IvoireCroatiaCuracaoCyprusCzech RepublicDenmarkDjiboutiDominicaDominican RepublicEarly-demographic dividendEast Asia & PacificEast Asia & Pacific (excluding high income)East Asia & Pacific (IDA & IBRD countries)EcuadorEgypt, Arab Rep.El SalvadorEquatorial GuineaEritreaEstoniaEthiopiaEuro areaEurope & Central AsiaEurope & Central Asia (excluding high income)Europe & Central Asia (IDA & IBRD countries)European UnionFaroe IslandsFijiFinlandFragile and conflict affected situationsFranceFrench PolynesiaGabonGambia, TheGeorgiaGermanyGhanaGreeceGrenadaGuatemalaGuineaGuinea-BissauGuyanaHaitiHeavily indebted poor countries (HIPC)High incomeHondurasHong Kong SAR, ChinaHungaryIBRD onlyIcelandIDA & IBRD totalIDA blendIDA onlyIDA totalIndiaIndonesiaIran, Islamic Rep.IraqIrelandIsraelItalyJamaicaJapanJordanKazakhstanKenyaKiribatiKorea, Rep.KosovoKuwaitKyrgyz RepublicLao PDRLate-demographic dividendLatin America & Caribbean Latin America & Caribbean (excluding high income)Latin America & the Caribbean (IDA & IBRD countries)LatviaLeast developed countries: UN classificationLebanonLesothoLiberiaLibyaLithuaniaLow & middle incomeLow incomeLower middle incomeLuxembourgMacao SAR, ChinaMacedonia, FYRMadagascarMalawiMalaysiaMaldivesMaliMaltaMarshall IslandsMauritaniaMauritiusMexicoMicronesia, Fed. Sts.Middle East & North Africa (excluding high income)Middle East & North Africa (IDA & IBRD countries)Middle incomeMoldovaMongoliaMontenegroMoroccoMozambiqueMyanmarNamibiaNepalNetherlandsNew CaledoniaNicaraguaNigerNigeriaNorth AmericaNorwayOECD membersOmanPacific island small statesPakistanPalauPanamaPapua New GuineaParaguayPeruPhilippinesPolandPortugalPost-demographic dividendPre-demographic dividendQatarRomaniaRussian FederationRwandaSamoaSao Tome and PrincipeSaudi ArabiaSenegalSerbiaSeychellesSierra LeoneSingaporeSint Maarten (Dutch part)Slovak RepublicSloveniaSolomon IslandsSouth AfricaSouth AsiaSouth Asia (IDA & IBRD)South SudanSpainSri LankaSt. Kitts and NevisSt. LuciaSt. Vincent and the GrenadinesSub-Saharan Africa Sub-Saharan Africa (excluding high income)Sub-Saharan Africa (IDA & IBRD countries)SudanSurinameSwazilandSwedenSwitzerlandSyrian Arab RepublicTajikistanTanzaniaThailandTimor-LesteTogoTongaTrinidad and TobagoTunisiaTurkeyTuvaluUgandaUkraineUnited KingdomUnited StatesUpper middle incomeUruguayVanuatuVenezuela, RBVietnamWest Bank and GazaWorldYemen, Rep.ZambiaZimbabwe La ligne de temps
Cette échelle de temps montre un graphique de 1978 année à 2014 année Grenada. Les données jusqu'à 1977 année ne sont pas présentés. Quantité d'observations actuelles selon dates: 37.
Source (désignation):
Les indicateurs du développement mondiale
Source (organisation):
International Monetary Fund, Balance of Payments Statistics Yearbook and data files.
Catégories:
Economy & Growth, Trade
Dernière mise à jour
23 avr. 2017
Les indicateurs de changement de valeurs selon les années
Minimum:
28.859 mln.
1 janv. 1978
Maximum:
235.727 mln.
1 janv. 2001
Pour la date d''observation
Valeur
Changement absolu
Le changement par rapport à la valeur précédente
1 janv. 1978
28.859 mln.
+28.859 mln.
0.0%
1 janv. 1979
33.3 mln.
+4.441 mln.
15.39%
1 janv. 1980
40.552 mln.
+7.252 mln.
21.78%
1 janv. 1981
38.0 mln.
-2.552 mln.
-6.29%
1 janv. 1982
37.7 mln.
-300.0 milles
-0.79%
1 janv. 1983
36.8 mln.
-900.0 milles
-2.39%
1 janv. 1984
37.9 mln.
+1.1 mln.
2.99%
1 janv. 1985
39.8 mln.
+1.9 mln.
5.01%
1 janv. 1986
52.893 mln.
+13.093 mln.
32.9%
1 janv. 1987
75.148 mln.
+22.256 mln.
42.08%
1 janv. 1988
79.778 mln.
+4.63 mln.
6.16%
1 janv. 1989
86.185 mln.
+6.407 mln.
8.03%
1 janv. 1990
85.333 mln.
-851.852 milles
-0.99%
1 janv. 1991
93.093 mln.
+7.759 mln.
9.09%
1 janv. 1992
97.548 mln.
+4.456 mln.
4.79%
1 janv. 1993
99.567 mln.
+2.019 mln.
2.07%
1 janv. 1994
110.426 mln.
+10.859 mln.
10.91%
1 janv. 1995
126.767 mln.
+16.341 mln.
14.8%
1 janv. 1996
123.763 mln.
-3.004 mln.
-2.37%
1 janv. 1997
131.615 mln.
+7.852 mln.
6.34%
1 janv. 1998
138.941 mln.
+7.326 mln.
5.57%
1 janv. 1999
165.719 mln.
+26.778 mln.
19.27%
1 janv. 2000
218.019 mln.
+52.3 mln.
31.56%
1 janv. 2001
235.727 mln.
+17.709 mln.
8.12%
1 janv. 2002
197.133 mln.
-38.594 mln.
-16.37%
1 janv. 2003
172.622 mln.
-24.511 mln.
-12.43%
1 janv. 2004
179.536 mln.
+6.913 mln.
4.0%
1 janv. 2005
197.737 mln.
+18.201 mln.
10.14%
1 janv. 2006
148.871 mln.
-48.866 mln.
-24.71%
1 janv. 2007
162.306 mln.
+13.435 mln.
9.02%
1 janv. 2008
209.546 mln.
+47.239 mln.
29.11%
1 janv. 2009
207.801 mln.
-1.745 mln.
-0.83%
1 janv. 2010
187.237 mln.
-20.563 mln.
-9.9%
1 janv. 2011
183.762 mln.
-3.475 mln.
-1.86%
1 janv. 2012
196.182 mln.
+12.42 mln.
6.76%
1 janv. 2013
206.491 mln.
+10.309 mln.
5.25%
1 janv. 2014
209.737 mln.
+3.246 mln.
1.57%
Classement des pays selon les statistiques actuelles par années


Commentaires: