29
/fr/
fr
AIzaSyAYiBZKx7MnpbEhh9jyipgxe19OcubqV5w
April 1, 2024
162484
Jamaica
JAM
true
2
1
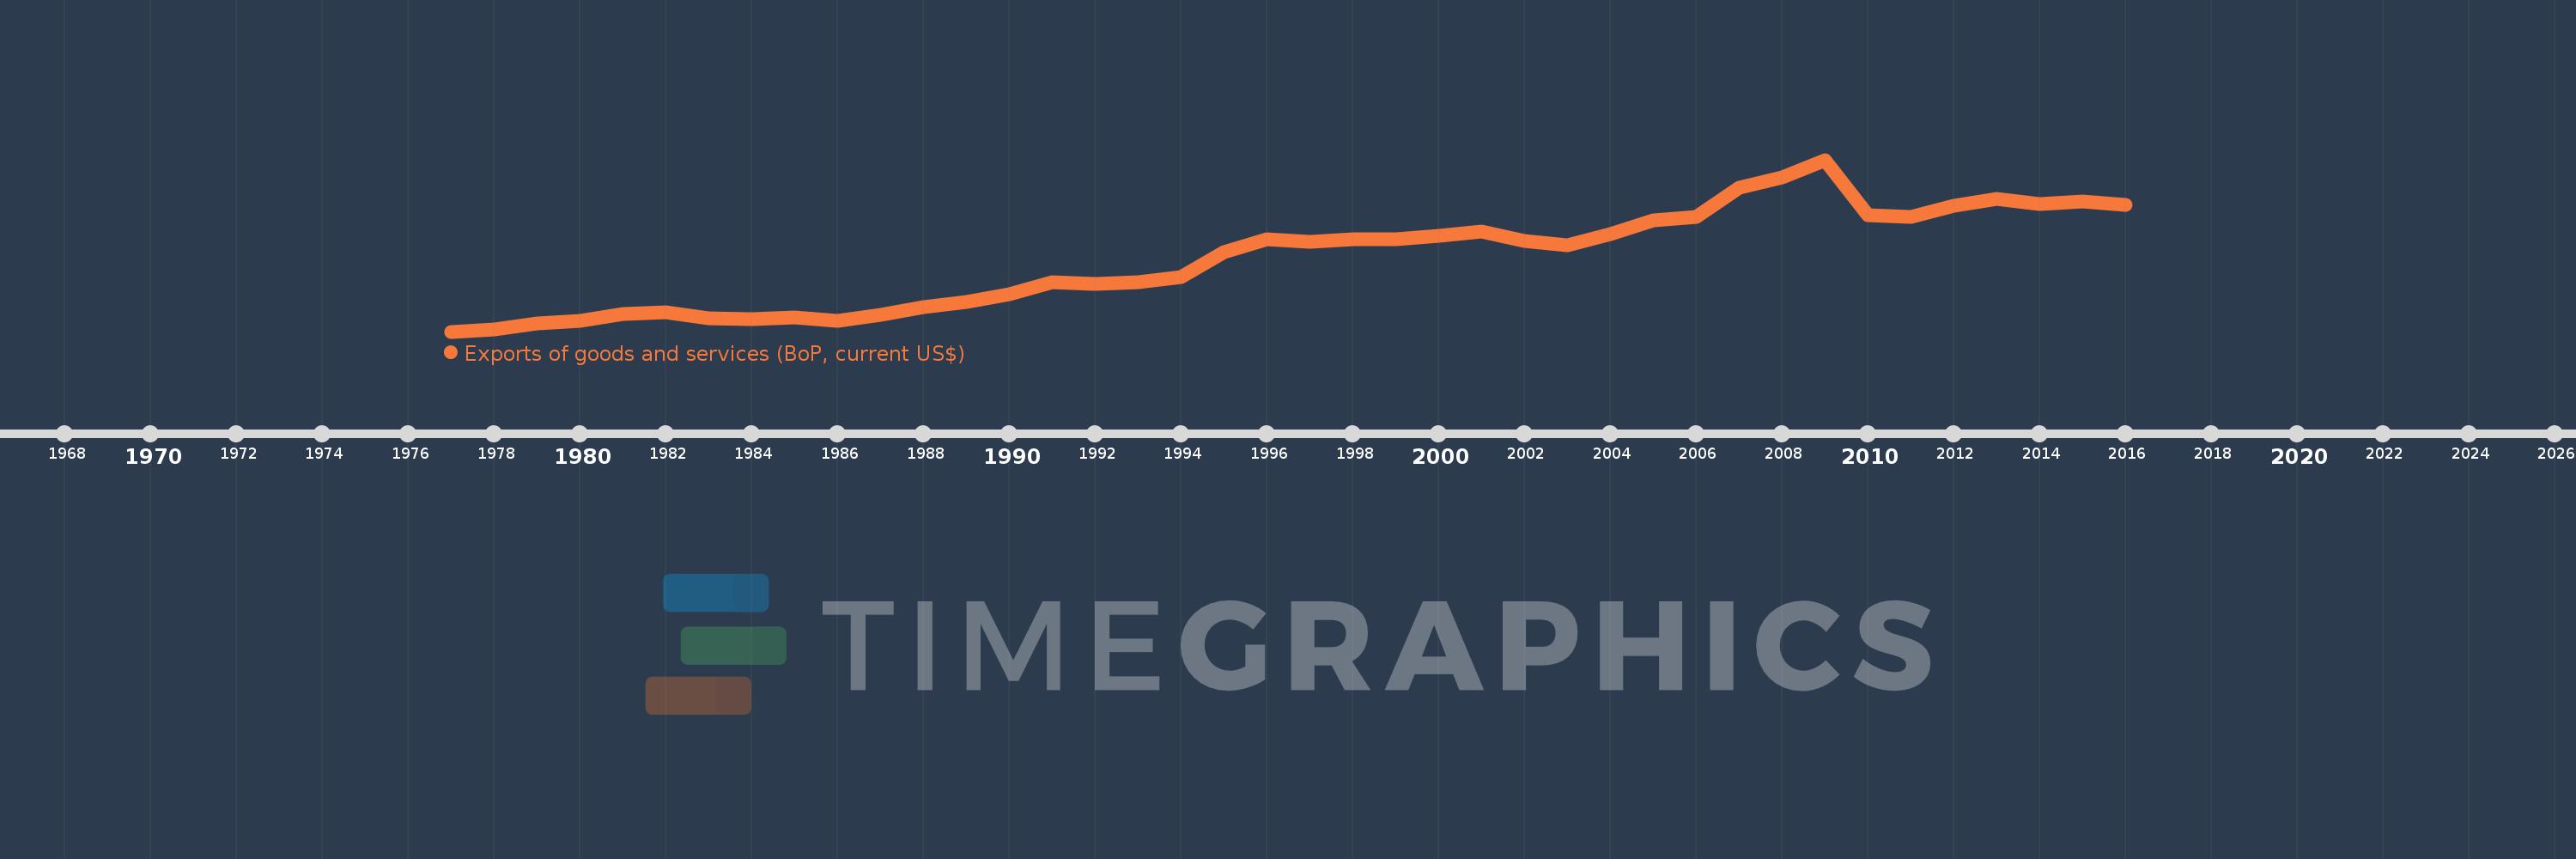
Exports of goods and services (BoP, current US$)
2016,2015,2014,2013,2012,2011,2010,2009,2008,2007,2006,2005,2004,2003,2002,2001,2000,1999,1998,1997,1996,1995,1994,1993,1992,1991,1990,1989,1988,1987,1986,1985,1984,1983,1982,1981,1980,1979,1978,1977
Cette statistique dans les autres pays:
AfghanistanAlbaniaAlgeriaAngolaAntigua and BarbudaArab WorldArgentinaArmeniaArubaAustraliaAustriaAzerbaijanBahamas, TheBahrainBangladeshBarbadosBelarusBelgiumBelizeBeninBermudaBhutanBoliviaBosnia and HerzegovinaBotswanaBrazilBrunei DarussalamBulgariaBurkina FasoBurundiCabo VerdeCambodiaCameroonCanadaCaribbean small statesCentral African RepublicCentral Europe and the BalticsChadChileChinaColombiaComorosCongo, Dem. Rep.Congo, Rep.Costa RicaCote d'IvoireCroatiaCuracaoCyprusCzech RepublicDenmarkDjiboutiDominicaDominican RepublicEarly-demographic dividendEast Asia & PacificEast Asia & Pacific (excluding high income)East Asia & Pacific (IDA & IBRD countries)EcuadorEgypt, Arab Rep.El SalvadorEquatorial GuineaEritreaEstoniaEthiopiaEuro areaEurope & Central AsiaEurope & Central Asia (excluding high income)Europe & Central Asia (IDA & IBRD countries)European UnionFaroe IslandsFijiFinlandFragile and conflict affected situationsFranceFrench PolynesiaGabonGambia, TheGeorgiaGermanyGhanaGreeceGrenadaGuatemalaGuineaGuinea-BissauGuyanaHaitiHeavily indebted poor countries (HIPC)High incomeHondurasHong Kong SAR, ChinaHungaryIBRD onlyIcelandIDA & IBRD totalIDA blendIDA onlyIDA totalIndiaIndonesiaIran, Islamic Rep.IraqIrelandIsraelItalyJamaicaJapanJordanKazakhstanKenyaKiribatiKorea, Rep.KosovoKuwaitKyrgyz RepublicLao PDRLate-demographic dividendLatin America & Caribbean Latin America & Caribbean (excluding high income)Latin America & the Caribbean (IDA & IBRD countries)LatviaLeast developed countries: UN classificationLebanonLesothoLiberiaLibyaLithuaniaLow & middle incomeLow incomeLower middle incomeLuxembourgMacao SAR, ChinaMacedonia, FYRMadagascarMalawiMalaysiaMaldivesMaliMaltaMarshall IslandsMauritaniaMauritiusMexicoMicronesia, Fed. Sts.Middle East & North Africa (excluding high income)Middle East & North Africa (IDA & IBRD countries)Middle incomeMoldovaMongoliaMontenegroMoroccoMozambiqueMyanmarNamibiaNepalNetherlandsNew CaledoniaNicaraguaNigerNigeriaNorth AmericaNorwayOECD membersOmanPacific island small statesPakistanPalauPanamaPapua New GuineaParaguayPeruPhilippinesPolandPortugalPost-demographic dividendPre-demographic dividendQatarRomaniaRussian FederationRwandaSamoaSao Tome and PrincipeSaudi ArabiaSenegalSerbiaSeychellesSierra LeoneSingaporeSint Maarten (Dutch part)Slovak RepublicSloveniaSolomon IslandsSouth AfricaSouth AsiaSouth Asia (IDA & IBRD)South SudanSpainSri LankaSt. Kitts and NevisSt. LuciaSt. Vincent and the GrenadinesSub-Saharan Africa Sub-Saharan Africa (excluding high income)Sub-Saharan Africa (IDA & IBRD countries)SudanSurinameSwazilandSwedenSwitzerlandSyrian Arab RepublicTajikistanTanzaniaThailandTimor-LesteTogoTongaTrinidad and TobagoTunisiaTurkeyTuvaluUgandaUkraineUnited KingdomUnited StatesUpper middle incomeUruguayVanuatuVenezuela, RBVietnamWest Bank and GazaWorldYemen, Rep.ZambiaZimbabwe La ligne de temps
Cette échelle de temps montre un graphique de 1977 année à 2016 année Jamaica. Les données jusqu'à 1976 année ne sont pas présentés. Quantité d'observations actuelles selon dates: 40.
Source (désignation):
Les indicateurs du développement mondiale
Source (organisation):
International Monetary Fund, Balance of Payments Statistics Yearbook and data files.
Catégories:
Economy & Growth, Trade
Dernière mise à jour
23 avr. 2017
Les indicateurs de changement de valeurs selon les années
Minimum:
889.1 mln.
1 janv. 1977
Maximum:
5.539 mds
1 janv. 2009
Pour la date d''observation
Valeur
Changement absolu
Le changement par rapport à la valeur précédente
1 janv. 1977
889.1 mln.
+889.1 mln.
0.0%
1 janv. 1978
955.0 mln.
+65.9 mln.
7.41%
1 janv. 1979
1.117 mds
+161.5 mln.
16.91%
1 janv. 1980
1.17 mds
+53.5 mln.
4.79%
1 janv. 1981
1.363 mds
+193.4 mln.
16.53%
1 janv. 1982
1.405 mds
+41.5 mln.
3.04%
1 janv. 1983
1.26 mds
-144.5 mln.
-10.29%
1 janv. 1984
1.226 mds
-34.6 mln.
-2.75%
1 janv. 1985
1.269 mds
+42.8 mln.
3.49%
1 janv. 1986
1.178 mds
-90.5 mln.
-7.13%
1 janv. 1987
1.343 mds
+164.9 mln.
14.0%
1 janv. 1988
1.563 mds
+219.7 mln.
16.36%
1 janv. 1989
1.684 mds
+121.0 mln.
7.74%
1 janv. 1990
1.905 mds
+221.3 mln.
13.14%
1 janv. 1991
2.217 mds
+312.1 mln.
16.38%
1 janv. 1992
2.189 mds
-28.3 mln.
-1.28%
1 janv. 1993
2.22 mds
+31.7 mln.
1.45%
1 janv. 1994
2.366 mds
+145.59 mln.
6.56%
1 janv. 1995
3.028 mds
+662.11 mln.
27.98%
1 janv. 1996
3.394 mds
+365.7 mln.
12.08%
1 janv. 1997
3.323 mds
-71.0 mln.
-2.09%
1 janv. 1998
3.399 mds
+76.3 mln.
2.3%
1 janv. 1999
3.384 mds
-15.4 mln.
-0.45%
1 janv. 2000
3.478 mds
+93.7 mln.
2.77%
1 janv. 2001
3.588 mds
+111.0 mln.
3.19%
1 janv. 2002
3.351 mds
-237.1 mln.
-6.61%
1 janv. 2003
3.221 mds
-130.04 mln.
-3.88%
1 janv. 2004
3.523 mds
+301.97 mln.
9.37%
1 janv. 2005
3.899 mds
+375.428 mln.
10.66%
1 janv. 2006
3.994 mds
+95.235 mln.
2.44%
1 janv. 2007
4.782 mds
+788.298 mln.
19.74%
1 janv. 2008
5.069 mds
+286.844 mln.
6.0%
1 janv. 2009
5.539 mds
+469.98 mln.
9.27%
1 janv. 2010
4.038 mds
-1.501 mds
-27.1%
1 janv. 2011
4.004 mds
-33.907 mln.
-0.84%
1 janv. 2012
4.286 mds
+281.93 mln.
7.04%
1 janv. 2013
4.484 mds
+197.918 mln.
4.62%
1 janv. 2014
4.336 mds
-148.627 mln.
-3.31%
1 janv. 2015
4.401 mds
+65.229 mln.
1.5%
1 janv. 2016
4.318 mds
-82.452 mln.
-1.87%
Classement des pays selon les statistiques actuelles par années


Commentaires: