29
/fr/
fr
AIzaSyAYiBZKx7MnpbEhh9jyipgxe19OcubqV5w
April 1, 2024
72178
Aruba
ABW
true
2
1
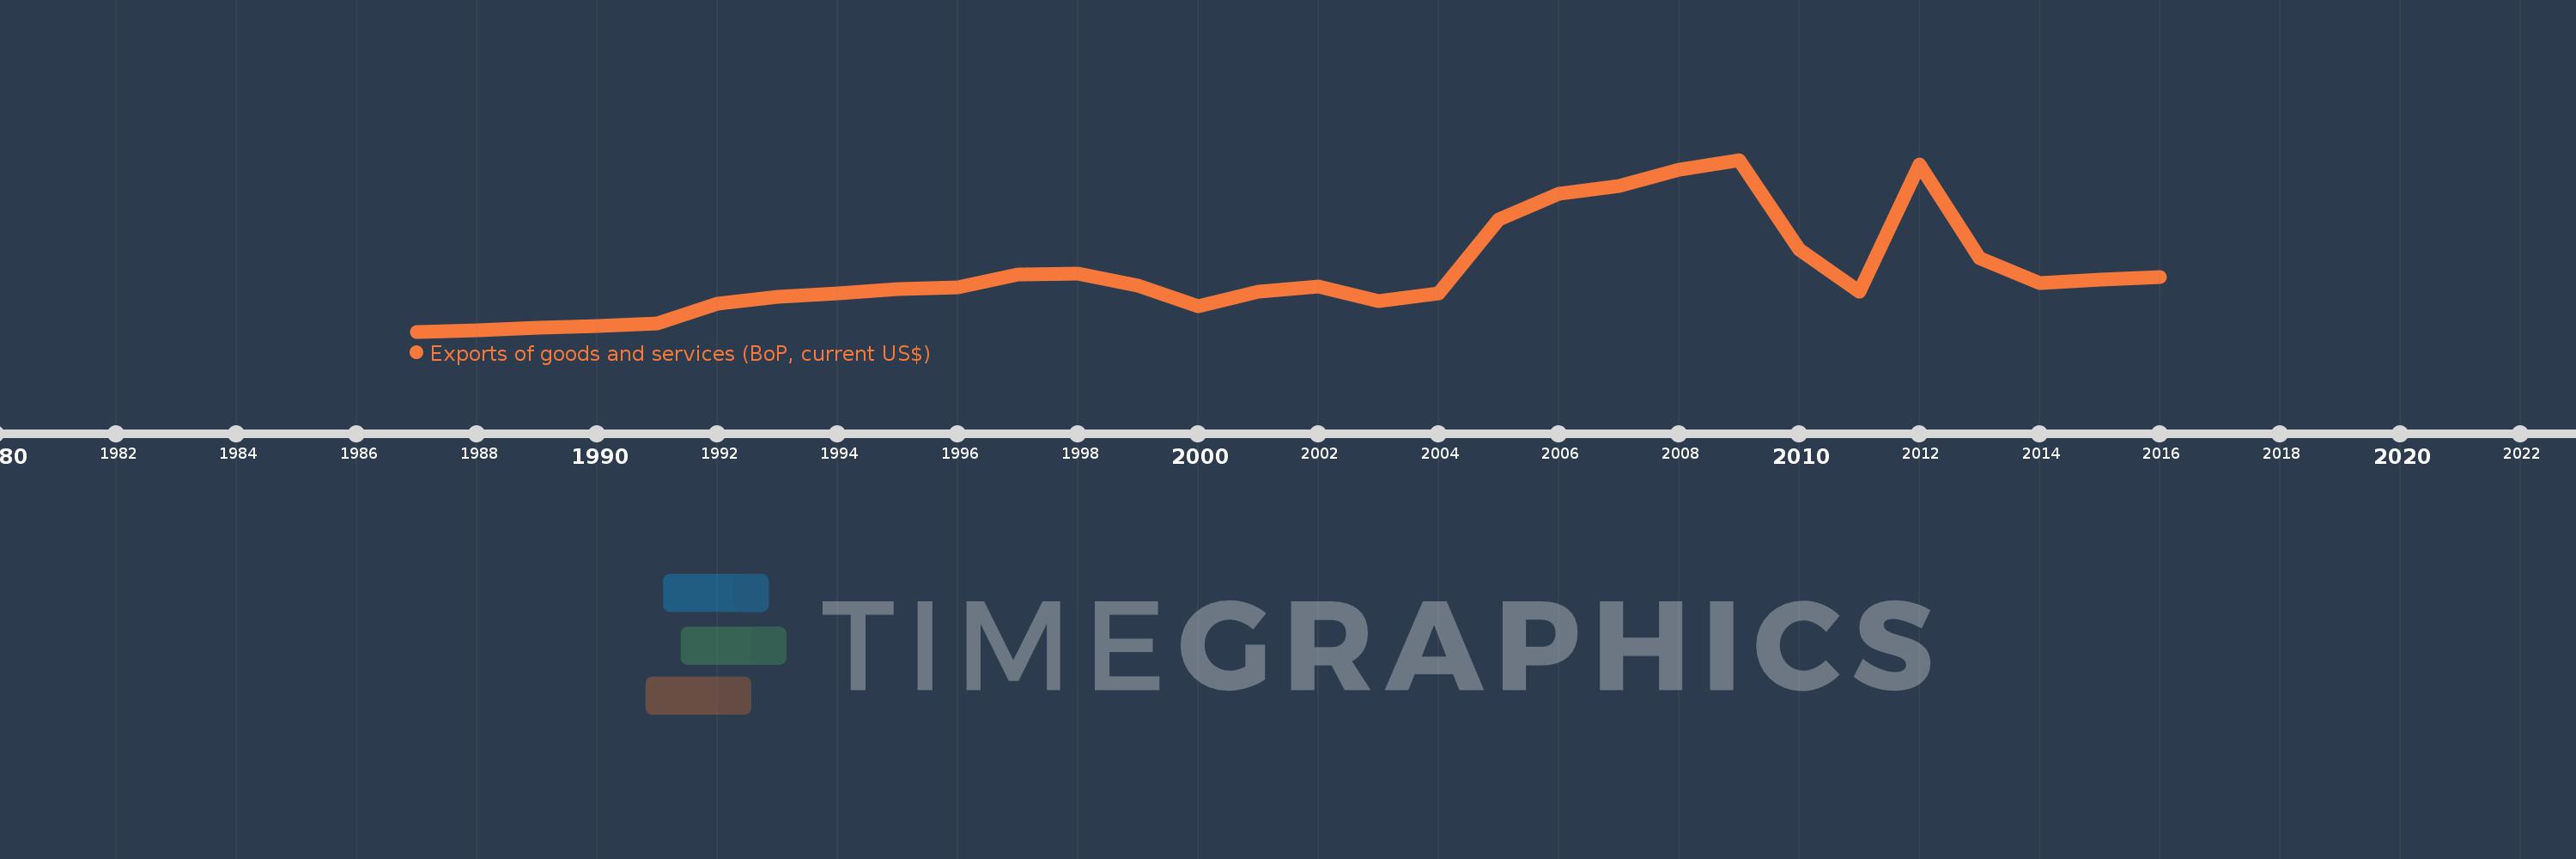
Exports of goods and services (BoP, current US$)
2016,2015,2014,2013,2012,2011,2010,2009,2008,2007,2006,2005,2004,2003,2002,2001,2000,1999,1998,1997,1996,1995,1994,1993,1992,1991,1990,1989,1988,1987
Cette statistique dans les autres pays:
AfghanistanAlbaniaAlgeriaAngolaAntigua and BarbudaArab WorldArgentinaArmeniaArubaAustraliaAustriaAzerbaijanBahamas, TheBahrainBangladeshBarbadosBelarusBelgiumBelizeBeninBermudaBhutanBoliviaBosnia and HerzegovinaBotswanaBrazilBrunei DarussalamBulgariaBurkina FasoBurundiCabo VerdeCambodiaCameroonCanadaCaribbean small statesCentral African RepublicCentral Europe and the BalticsChadChileChinaColombiaComorosCongo, Dem. Rep.Congo, Rep.Costa RicaCote d'IvoireCroatiaCuracaoCyprusCzech RepublicDenmarkDjiboutiDominicaDominican RepublicEarly-demographic dividendEast Asia & PacificEast Asia & Pacific (excluding high income)East Asia & Pacific (IDA & IBRD countries)EcuadorEgypt, Arab Rep.El SalvadorEquatorial GuineaEritreaEstoniaEthiopiaEuro areaEurope & Central AsiaEurope & Central Asia (excluding high income)Europe & Central Asia (IDA & IBRD countries)European UnionFaroe IslandsFijiFinlandFragile and conflict affected situationsFranceFrench PolynesiaGabonGambia, TheGeorgiaGermanyGhanaGreeceGrenadaGuatemalaGuineaGuinea-BissauGuyanaHaitiHeavily indebted poor countries (HIPC)High incomeHondurasHong Kong SAR, ChinaHungaryIBRD onlyIcelandIDA & IBRD totalIDA blendIDA onlyIDA totalIndiaIndonesiaIran, Islamic Rep.IraqIrelandIsraelItalyJamaicaJapanJordanKazakhstanKenyaKiribatiKorea, Rep.KosovoKuwaitKyrgyz RepublicLao PDRLate-demographic dividendLatin America & Caribbean Latin America & Caribbean (excluding high income)Latin America & the Caribbean (IDA & IBRD countries)LatviaLeast developed countries: UN classificationLebanonLesothoLiberiaLibyaLithuaniaLow & middle incomeLow incomeLower middle incomeLuxembourgMacao SAR, ChinaMacedonia, FYRMadagascarMalawiMalaysiaMaldivesMaliMaltaMarshall IslandsMauritaniaMauritiusMexicoMicronesia, Fed. Sts.Middle East & North Africa (excluding high income)Middle East & North Africa (IDA & IBRD countries)Middle incomeMoldovaMongoliaMontenegroMoroccoMozambiqueMyanmarNamibiaNepalNetherlandsNew CaledoniaNicaraguaNigerNigeriaNorth AmericaNorwayOECD membersOmanPacific island small statesPakistanPalauPanamaPapua New GuineaParaguayPeruPhilippinesPolandPortugalPost-demographic dividendPre-demographic dividendQatarRomaniaRussian FederationRwandaSamoaSao Tome and PrincipeSaudi ArabiaSenegalSerbiaSeychellesSierra LeoneSingaporeSint Maarten (Dutch part)Slovak RepublicSloveniaSolomon IslandsSouth AfricaSouth AsiaSouth Asia (IDA & IBRD)South SudanSpainSri LankaSt. Kitts and NevisSt. LuciaSt. Vincent and the GrenadinesSub-Saharan Africa Sub-Saharan Africa (excluding high income)Sub-Saharan Africa (IDA & IBRD countries)SudanSurinameSwazilandSwedenSwitzerlandSyrian Arab RepublicTajikistanTanzaniaThailandTimor-LesteTogoTongaTrinidad and TobagoTunisiaTurkeyTuvaluUgandaUkraineUnited KingdomUnited StatesUpper middle incomeUruguayVanuatuVenezuela, RBVietnamWest Bank and GazaWorldYemen, Rep.ZambiaZimbabwe La ligne de temps
Cette échelle de temps montre un graphique de 1987 année à 2016 année Aruba. Les données jusqu'à 1986 année ne sont pas présentés. Quantité d'observations actuelles selon dates: 30.
Source (désignation):
Les indicateurs du développement mondiale
Source (organisation):
International Monetary Fund, Balance of Payments Statistics Yearbook and data files.
Catégories:
Economy & Growth, Trade
Dernière mise à jour
23 avr. 2017
Les indicateurs de changement de valeurs selon les années
Minimum:
246.425 mln.
1 janv. 1987
Maximum:
7.06 mds
1 janv. 2009
Pour la date d''observation
Valeur
Changement absolu
Le changement par rapport à la valeur précédente
1 janv. 1987
246.425 mln.
+246.425 mln.
0.0%
1 janv. 1988
305.196 mln.
+58.771 mln.
23.85%
1 janv. 1989
413.575 mln.
+108.38 mln.
35.51%
1 janv. 1990
458.827 mln.
+45.251 mln.
10.94%
1 janv. 1991
566.48 mln.
+107.654 mln.
23.46%
1 janv. 1992
1.351 mds
+784.972 mln.
138.57%
1 janv. 1993
1.64 mds
+288.939 mln.
21.38%
1 janv. 1994
1.758 mds
+118.045 mln.
7.2%
1 janv. 1995
1.921 mds
+162.57 mln.
9.25%
1 janv. 1996
1.992 mds
+71.341 mln.
3.71%
1 janv. 1997
2.506 mds
+513.24 mln.
25.76%
1 janv. 1998
2.544 mds
+38.827 mln.
1.55%
1 janv. 1999
2.057 mds
-487.542 mln.
-19.16%
1 janv. 2000
1.25 mds
-806.531 mln.
-39.21%
1 janv. 2001
1.816 mds
+565.279 mln.
45.21%
1 janv. 2002
2.018 mds
+202.587 mln.
11.16%
1 janv. 2003
1.449 mds
-569.425 mln.
-28.21%
1 janv. 2004
1.766 mds
+317.358 mln.
21.91%
1 janv. 2005
4.688 mds
+2.922 mds
165.43%
1 janv. 2006
5.724 mds
+1.036 mds
22.1%
1 janv. 2007
6.026 mds
+302.245 mln.
5.28%
1 janv. 2008
6.678 mds
+651.559 mln.
10.81%
1 janv. 2009
7.06 mds
+381.844 mln.
5.72%
1 janv. 2010
3.49 mds
-3.57 mds
-50.56%
1 janv. 2011
1.825 mds
-1.665 mds
-47.72%
1 janv. 2012
6.861 mds
+5.036 mds
276.03%
1 janv. 2013
3.151 mds
-3.71 mds
-54.07%
1 janv. 2014
2.162 mds
-989.162 mln.
-31.39%
1 janv. 2015
2.299 mds
+137.263 mln.
6.35%
1 janv. 2016
2.421 mds
+122.067 mln.
5.31%
Classement des pays selon les statistiques actuelles par années


Commentaires: