29
/fr/
fr
AIzaSyAYiBZKx7MnpbEhh9jyipgxe19OcubqV5w
April 1, 2024
91961
Brazil
BRA
true
2
1
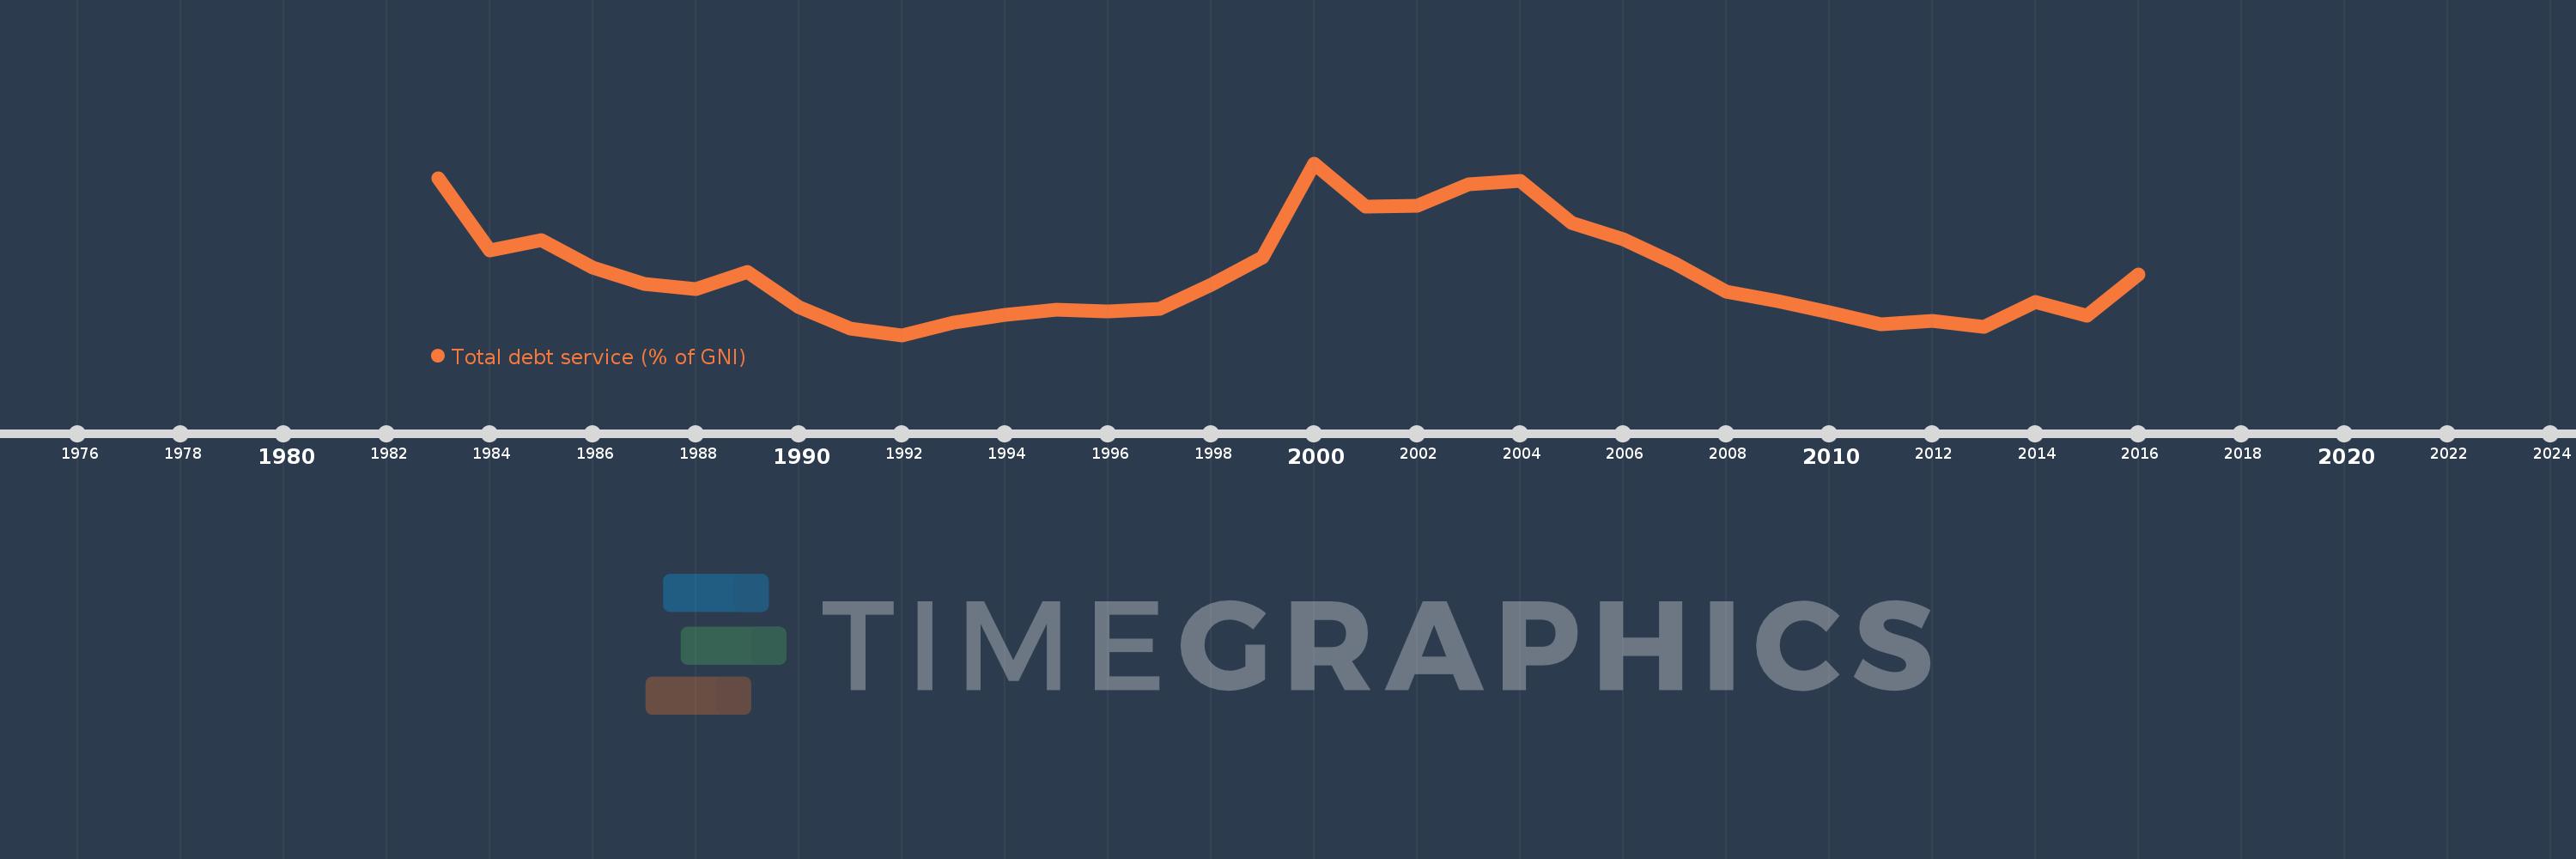
Total debt service (% of GNI)
2016,2015,2014,2013,2012,2011,2010,2009,2008,2007,2006,2005,2004,2003,2002,2001,2000,1999,1998,1997,1996,1995,1994,1993,1992,1991,1990,1989,1988,1987,1986,1985,1984,1983
Cette statistique dans les autres pays:
La ligne de temps
Cette échelle de temps montre un graphique de 1983 année à 2016 année Brazil. Les données jusqu'à 1982 année ne sont pas présentés. Quantité d'observations actuelles selon dates: 34.
Source (désignation):
Les indicateurs du développement mondiale
Source (organisation):
World Bank, International Debt Statistics.
Catégories:
Economy & Growth, External Debt
Dernière mise à jour
23 avr. 2017
Les indicateurs de changement de valeurs selon les années
Minimum:
1.425
1 janv. 1992
Maximum:
12.003
1 janv. 2000
Pour la date d''observation
Valeur
Changement absolu
Le changement par rapport à la valeur précédente
1 janv. 1983
11.053
+11.053
0.0%
1 janv. 1984
6.658
-4.395
-39.76%
1 janv. 1985
7.28
+0.622
9.34%
1 janv. 1986
5.572
-1.708
-23.46%
1 janv. 1987
4.591
-0.981
-17.61%
1 janv. 1988
4.26
-0.331
-7.22%
1 janv. 1989
5.334
+1.075
25.23%
1 janv. 1990
3.163
-2.172
-40.71%
1 janv. 1991
1.829
-1.334
-42.17%
1 janv. 1992
1.425
-0.404
-22.1%
1 janv. 1993
2.216
+0.791
55.53%
1 janv. 1994
2.645
+0.429
19.37%
1 janv. 1995
2.979
+0.334
12.63%
1 janv. 1996
2.855
-0.124
-4.17%
1 janv. 1997
3.055
+0.2
7.01%
1 janv. 1998
4.516
+1.461
47.83%
1 janv. 1999
6.229
+1.713
37.94%
1 janv. 2000
12.003
+5.774
92.69%
1 janv. 2001
9.346
-2.658
-22.14%
1 janv. 2002
9.372
+0.027
0.29%
1 janv. 2003
10.698
+1.326
14.15%
1 janv. 2004
10.916
+0.218
2.04%
1 janv. 2005
8.352
-2.564
-23.49%
1 janv. 2006
7.342
-1.009
-12.08%
1 janv. 2007
5.859
-1.483
-20.2%
1 janv. 2008
4.109
-1.75
-29.87%
1 janv. 2009
3.502
-0.607
-14.76%
1 janv. 2010
2.804
-0.699
-19.95%
1 janv. 2011
2.112
-0.692
-24.68%
1 janv. 2012
2.298
+0.186
8.8%
1 janv. 2013
1.91
-0.387
-16.85%
1 janv. 2014
3.482
+1.572
82.29%
1 janv. 2015
2.625
-0.857
-24.62%
1 janv. 2016
5.175
+2.551
97.17%
Classement des pays selon les statistiques actuelles par années


Commentaires: