29
/fr/
fr
AIzaSyAYiBZKx7MnpbEhh9jyipgxe19OcubqV5w
April 1, 2024
147514
Guinea-Bissau
GNB
true
2
1
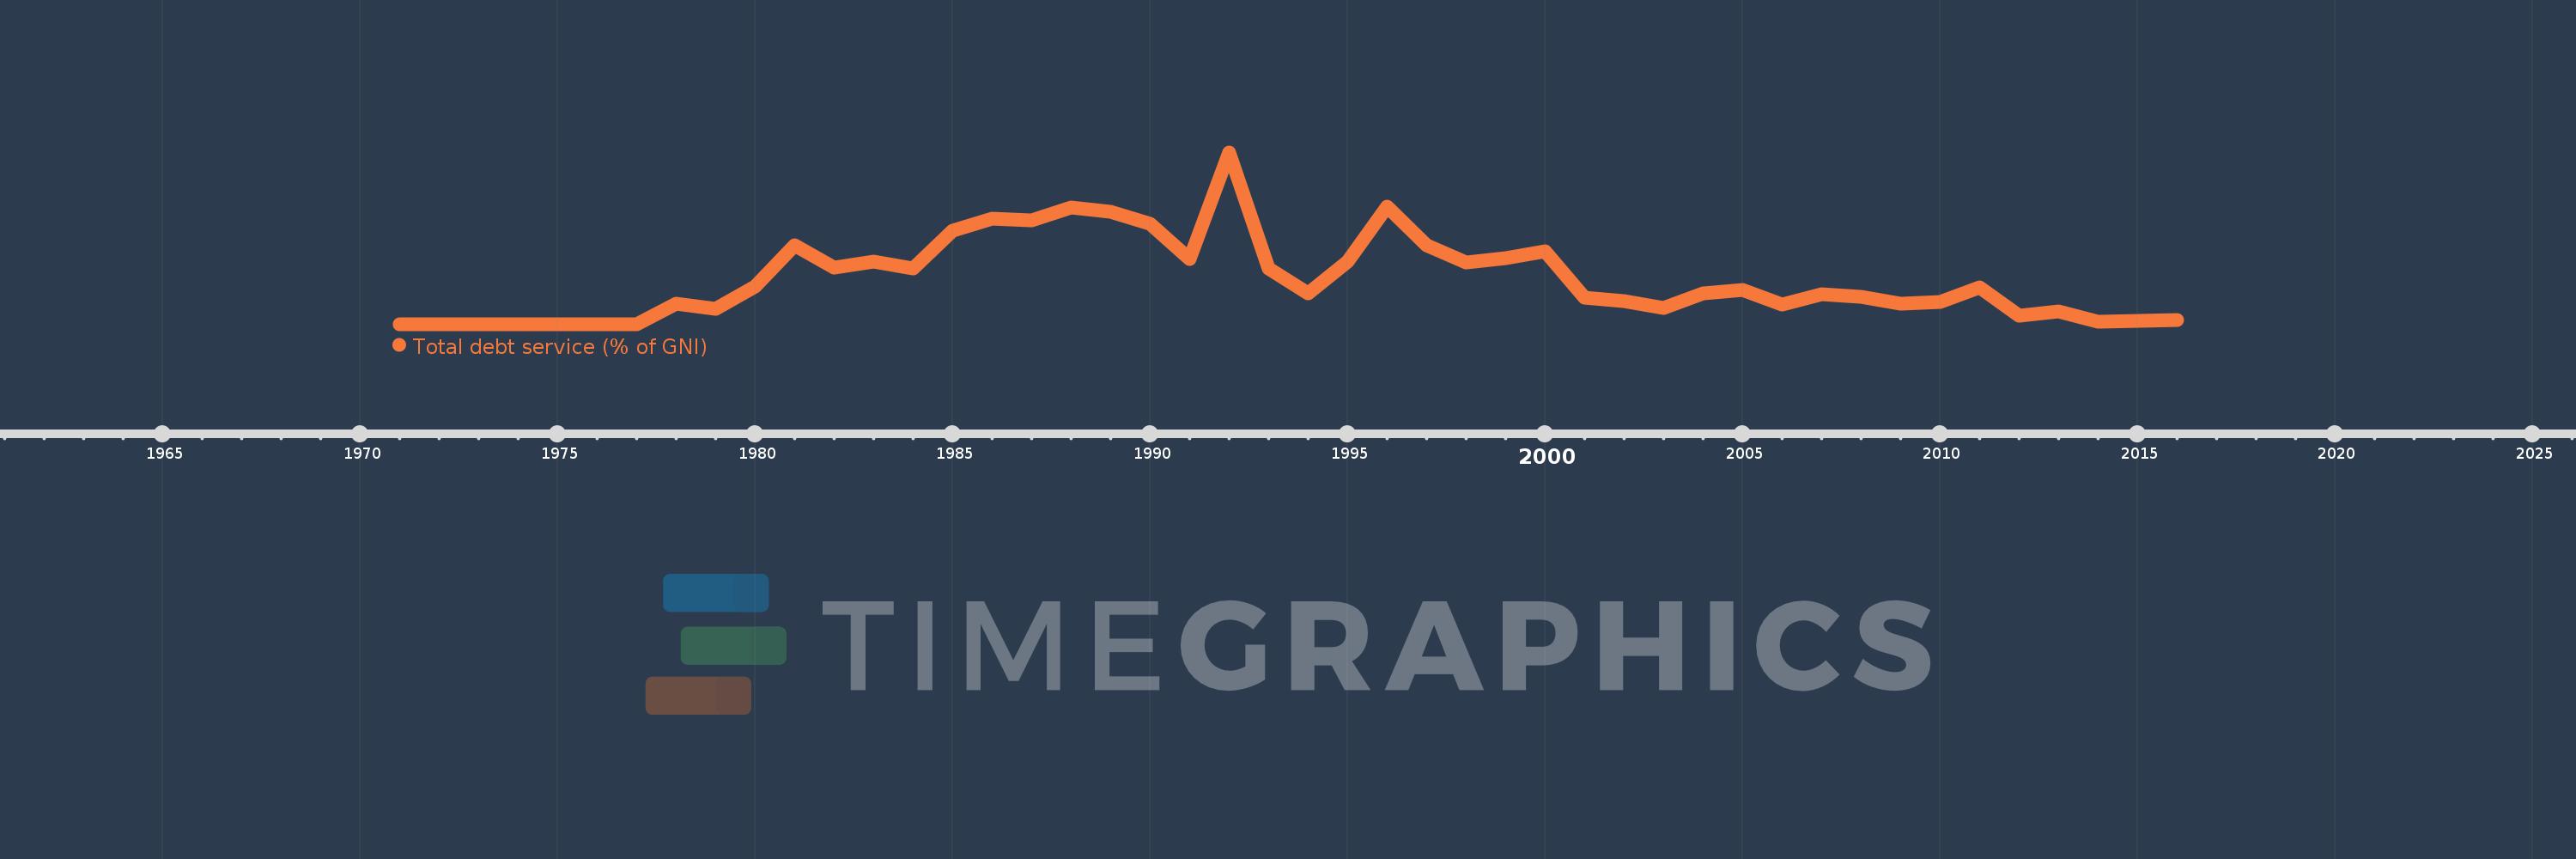
Total debt service (% of GNI)
2016,2015,2014,2013,2012,2011,2010,2009,2008,2007,2006,2005,2004,2003,2002,2001,2000,1999,1998,1997,1996,1995,1994,1993,1992,1991,1990,1989,1988,1987,1986,1985,1984,1983,1982,1981,1980,1979,1978,1977,1976,1975,1974,1973,1972,1971
Cette statistique dans les autres pays:
La ligne de temps
Cette échelle de temps montre un graphique de 1971 année à 2016 année Guinea-Bissau. Les données jusqu'à 1970 année ne sont pas présentés. Quantité d'observations actuelles selon dates: 46.
Source (désignation):
Les indicateurs du développement mondiale
Source (organisation):
World Bank, International Debt Statistics.
Catégories:
Economy & Growth, External Debt
Dernière mise à jour
23 avr. 2017
Les indicateurs de changement de valeurs selon les années
Maximum:
9.575
1 janv. 1992
Pour la date d''observation
Valeur
Changement absolu
Le changement par rapport à la valeur précédente
1 janv. 1977
0.019
+0.019
%
1 janv. 1978
1.132
+1.113
5.84 milles%
1 janv. 1979
0.839
-0.293
-25.85%
1 janv. 1980
2.11
+1.27
151.34%
1 janv. 1981
4.415
+2.305
109.26%
1 janv. 1982
3.136
-1.279
-28.96%
1 janv. 1983
3.478
+0.342
10.91%
1 janv. 1984
3.121
-0.358
-10.28%
1 janv. 1985
5.208
+2.087
66.89%
1 janv. 1986
5.896
+0.688
13.21%
1 janv. 1987
5.786
-0.11
-1.86%
1 janv. 1988
6.492
+0.705
12.19%
1 janv. 1989
6.282
-0.21
-3.23%
1 janv. 1990
5.573
-0.709
-11.29%
1 janv. 1991
3.613
-1.96
-35.17%
1 janv. 1992
9.575
+5.962
165.01%
1 janv. 1993
3.123
-6.452
-67.38%
1 janv. 1994
1.711
-1.412
-45.2%
1 janv. 1995
3.467
+1.756
102.6%
1 janv. 1996
6.573
+3.106
89.58%
1 janv. 1997
4.412
-2.161
-32.87%
1 janv. 1998
3.435
-0.977
-22.15%
1 janv. 1999
3.67
+0.235
6.85%
1 janv. 2000
4.053
+0.383
10.43%
1 janv. 2001
1.463
-2.59
-63.91%
1 janv. 2002
1.281
-0.182
-12.41%
1 janv. 2003
0.909
-0.372
-29.06%
1 janv. 2004
1.699
+0.79
86.89%
1 janv. 2005
1.905
+0.207
12.16%
1 janv. 2006
1.107
-0.798
-41.88%
1 janv. 2007
1.676
+0.569
51.35%
1 janv. 2008
1.526
-0.15
-8.97%
1 janv. 2009
1.146
-0.38
-24.9%
1 janv. 2010
1.249
+0.104
9.05%
1 janv. 2011
2.067
+0.818
65.45%
1 janv. 2012
0.463
-1.604
-77.61%
1 janv. 2013
0.695
+0.232
50.08%
1 janv. 2014
0.149
-0.545
-78.48%
1 janv. 2015
0.18
+0.031
20.46%
1 janv. 2016
0.234
+0.054
29.82%
Classement des pays selon les statistiques actuelles par années


Commentaires: