30
/fr/
AIzaSyAYiBZKx7MnpbEhh9jyipgxe19OcubqV5w
April 1, 2024
285366
Yemen, Rep.
YEM
true
2
1
Total debt service (% of GNI)
2016,2015,2014,2013,2012,2011,2010,2009,2008,2007,2006,2005,2004,2003,2002,2001,2000,1999,1998,1997,1996,1995,1994,1993,1992,1991
Download
Bibliothèque de statistiques globales →Yemen, Rep. →

Total debt service (% of GNI)

Cette statistique dans les autres pays:

AfghanistanAlbaniaAlgeriaAngolaArab WorldArgentinaArmeniaAzerbaijanBangladeshBelarusBelizeBeninBhutanBoliviaBosnia and HerzegovinaBotswanaBrazilBulgariaBurkina FasoBurundiCabo VerdeCambodiaCameroonCentral African RepublicCentral Europe and the BalticsChadChinaColombiaComorosCongo, Dem. Rep.Congo, Rep.Costa RicaCote d'IvoireDjiboutiDominicaDominican RepublicEarly-demographic dividendEast Asia & Pacific (excluding high income)East Asia & Pacific (IDA & IBRD countries)EcuadorEgypt, Arab Rep.El SalvadorEritreaEthiopiaEurope & Central Asia (excluding high income)Europe & Central Asia (IDA & IBRD countries)FijiFragile and conflict affected situationsGabonGambia, TheGeorgiaGhanaGrenadaGuatemalaGuineaGuinea-BissauGuyanaHaitiHeavily indebted poor countries (HIPC)HondurasIBRD onlyIDA & IBRD totalIDA blendIDA onlyIDA totalIndiaIndonesiaIran, Islamic Rep.JamaicaJordanKazakhstanKenyaKosovoKyrgyz RepublicLao PDRLate-demographic dividendLatin America & Caribbean Latin America & Caribbean (excluding high income)Latin America & the Caribbean (IDA & IBRD countries)Least developed countries: UN classificationLebanonLesothoLiberiaLow & middle incomeLow incomeLower middle incomeMacedonia, FYRMadagascarMalawiMalaysiaMaldivesMaliMauritaniaMauritiusMexicoMiddle East & North Africa (excluding high income)Middle East & North Africa (IDA & IBRD countries)Middle incomeMoldovaMongoliaMontenegroMoroccoMozambiqueMyanmarNepalNicaraguaNigerNigeriaPacific island small statesPakistanPanamaPapua New GuineaParaguayPeruPhilippinesPre-demographic dividendRomaniaRussian FederationRwandaSamoaSao Tome and PrincipeSenegalSerbiaSierra LeoneSolomon IslandsSomaliaSouth AfricaSouth AsiaSouth Asia (IDA & IBRD)Sri LankaSt. LuciaSt. Vincent and the GrenadinesSub-Saharan Africa Sub-Saharan Africa (excluding high income)Sub-Saharan Africa (IDA & IBRD countries)SudanSwazilandSyrian Arab RepublicTajikistanTanzaniaThailandTogoTongaTunisiaTurkeyTurkmenistanUgandaUkraineUpper middle incomeUzbekistanVanuatuVenezuela, RBVietnamYemen, Rep.ZambiaZimbabwe

La ligne de temps

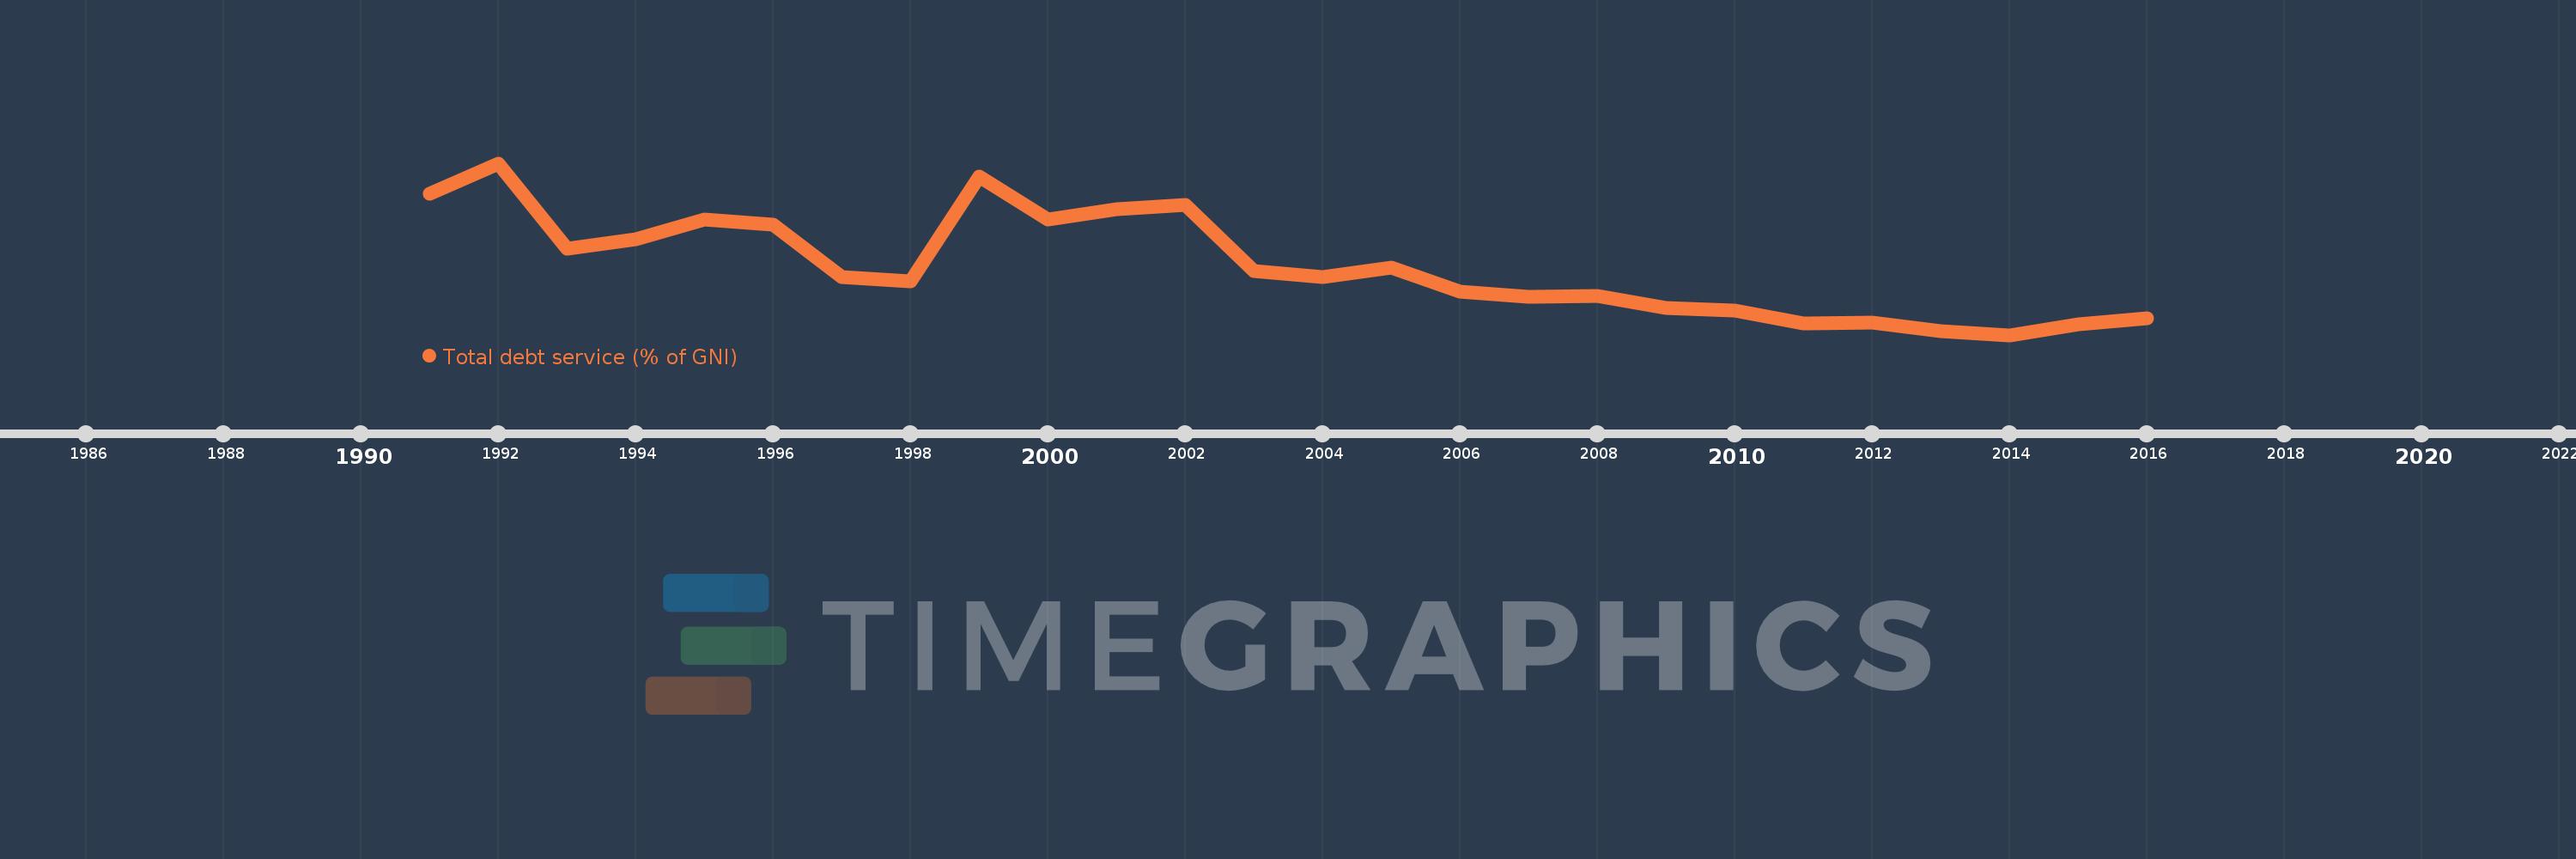
Cette échelle de temps montre un graphique de 1991 année à 2016 année Yemen, Rep.. Les données jusqu'à 1990 année ne sont pas présentés. Quantité d'observations actuelles selon dates: 26.

Source (désignation):

Les indicateurs du développement mondiale

Source (organisation):

World Bank, International Debt Statistics.

Catégories:

Economy & Growth, External Debt

Dernière mise à jour

23 avr. 2017

Les indicateurs de changement de valeurs selon les années

En moyenne:
1.819
Minimum:
0.699
1 janv. 2014
Maximum:
3.509
1 janv. 1992
Pour la date d''observation
Valeur
Changement absolu
Le changement par rapport à la valeur précédente
1 janv. 1991
3.013
+3.013
0.0%
1 janv. 1992
3.509
+0.496
16.46%
1 janv. 1993
2.107
-1.403
-39.97%
1 janv. 1994
2.27
+0.163
7.76%
1 janv. 1995
2.589
+0.32
14.08%
1 janv. 1996
2.502
-0.088
-3.39%
1 janv. 1997
1.644
-0.858
-34.3%
1 janv. 1998
1.573
-0.071
-4.29%
1 janv. 1999
3.293
+1.72
109.36%
1 janv. 2000
2.59
-0.703
-21.35%
1 janv. 2001
2.759
+0.169
6.51%
1 janv. 2002
2.833
+0.074
2.68%
1 janv. 2003
1.751
-1.082
-38.18%
1 janv. 2004
1.653
-0.099
-5.63%
1 janv. 2005
1.799
+0.147
8.88%
1 janv. 2006
1.41
-0.389
-21.62%
1 janv. 2007
1.326
-0.085
-6.0%
1 janv. 2008
1.345
+0.019
1.45%
1 janv. 2009
1.138
-0.207
-15.4%
1 janv. 2010
1.1
-0.038
-3.32%
1 janv. 2011
0.883
-0.217
-19.73%
1 janv. 2012
0.904
+0.021
2.42%
1 janv. 2013
0.757
-0.147
-16.26%
1 janv. 2014
0.699
-0.058
-7.69%
1 janv. 2015
0.877
+0.178
25.43%
1 janv. 2016
0.977
+0.1
11.43%

Classement des pays selon les statistiques actuelles par années