30
/fr/
AIzaSyAYiBZKx7MnpbEhh9jyipgxe19OcubqV5w
April 1, 2024
283087
Vietnam
VNM
true
2
1
Total debt service (% of GNI)
2016,2015,2014,2013,2012,2011,2010,2009,2008,2007,2006,2005,2004,2003,2002,2001,2000,1999,1998,1997,1996,1995,1994,1993,1992,1991,1990
Download
Bibliothèque de statistiques globales →Vietnam →

Total debt service (% of GNI)

Cette statistique dans les autres pays:

AfghanistanAlbaniaAlgeriaAngolaArab WorldArgentinaArmeniaAzerbaijanBangladeshBelarusBelizeBeninBhutanBoliviaBosnia and HerzegovinaBotswanaBrazilBulgariaBurkina FasoBurundiCabo VerdeCambodiaCameroonCentral African RepublicCentral Europe and the BalticsChadChinaColombiaComorosCongo, Dem. Rep.Congo, Rep.Costa RicaCote d'IvoireDjiboutiDominicaDominican RepublicEarly-demographic dividendEast Asia & Pacific (excluding high income)East Asia & Pacific (IDA & IBRD countries)EcuadorEgypt, Arab Rep.El SalvadorEritreaEthiopiaEurope & Central Asia (excluding high income)Europe & Central Asia (IDA & IBRD countries)FijiFragile and conflict affected situationsGabonGambia, TheGeorgiaGhanaGrenadaGuatemalaGuineaGuinea-BissauGuyanaHaitiHeavily indebted poor countries (HIPC)HondurasIBRD onlyIDA & IBRD totalIDA blendIDA onlyIDA totalIndiaIndonesiaIran, Islamic Rep.JamaicaJordanKazakhstanKenyaKosovoKyrgyz RepublicLao PDRLate-demographic dividendLatin America & Caribbean Latin America & Caribbean (excluding high income)Latin America & the Caribbean (IDA & IBRD countries)Least developed countries: UN classificationLebanonLesothoLiberiaLow & middle incomeLow incomeLower middle incomeMacedonia, FYRMadagascarMalawiMalaysiaMaldivesMaliMauritaniaMauritiusMexicoMiddle East & North Africa (excluding high income)Middle East & North Africa (IDA & IBRD countries)Middle incomeMoldovaMongoliaMontenegroMoroccoMozambiqueMyanmarNepalNicaraguaNigerNigeriaPacific island small statesPakistanPanamaPapua New GuineaParaguayPeruPhilippinesPre-demographic dividendRomaniaRussian FederationRwandaSamoaSao Tome and PrincipeSenegalSerbiaSierra LeoneSolomon IslandsSomaliaSouth AfricaSouth AsiaSouth Asia (IDA & IBRD)Sri LankaSt. LuciaSt. Vincent and the GrenadinesSub-Saharan Africa Sub-Saharan Africa (excluding high income)Sub-Saharan Africa (IDA & IBRD countries)SudanSwazilandSyrian Arab RepublicTajikistanTanzaniaThailandTogoTongaTunisiaTurkeyTurkmenistanUgandaUkraineUpper middle incomeUzbekistanVanuatuVenezuela, RBVietnamYemen, Rep.ZambiaZimbabwe

La ligne de temps

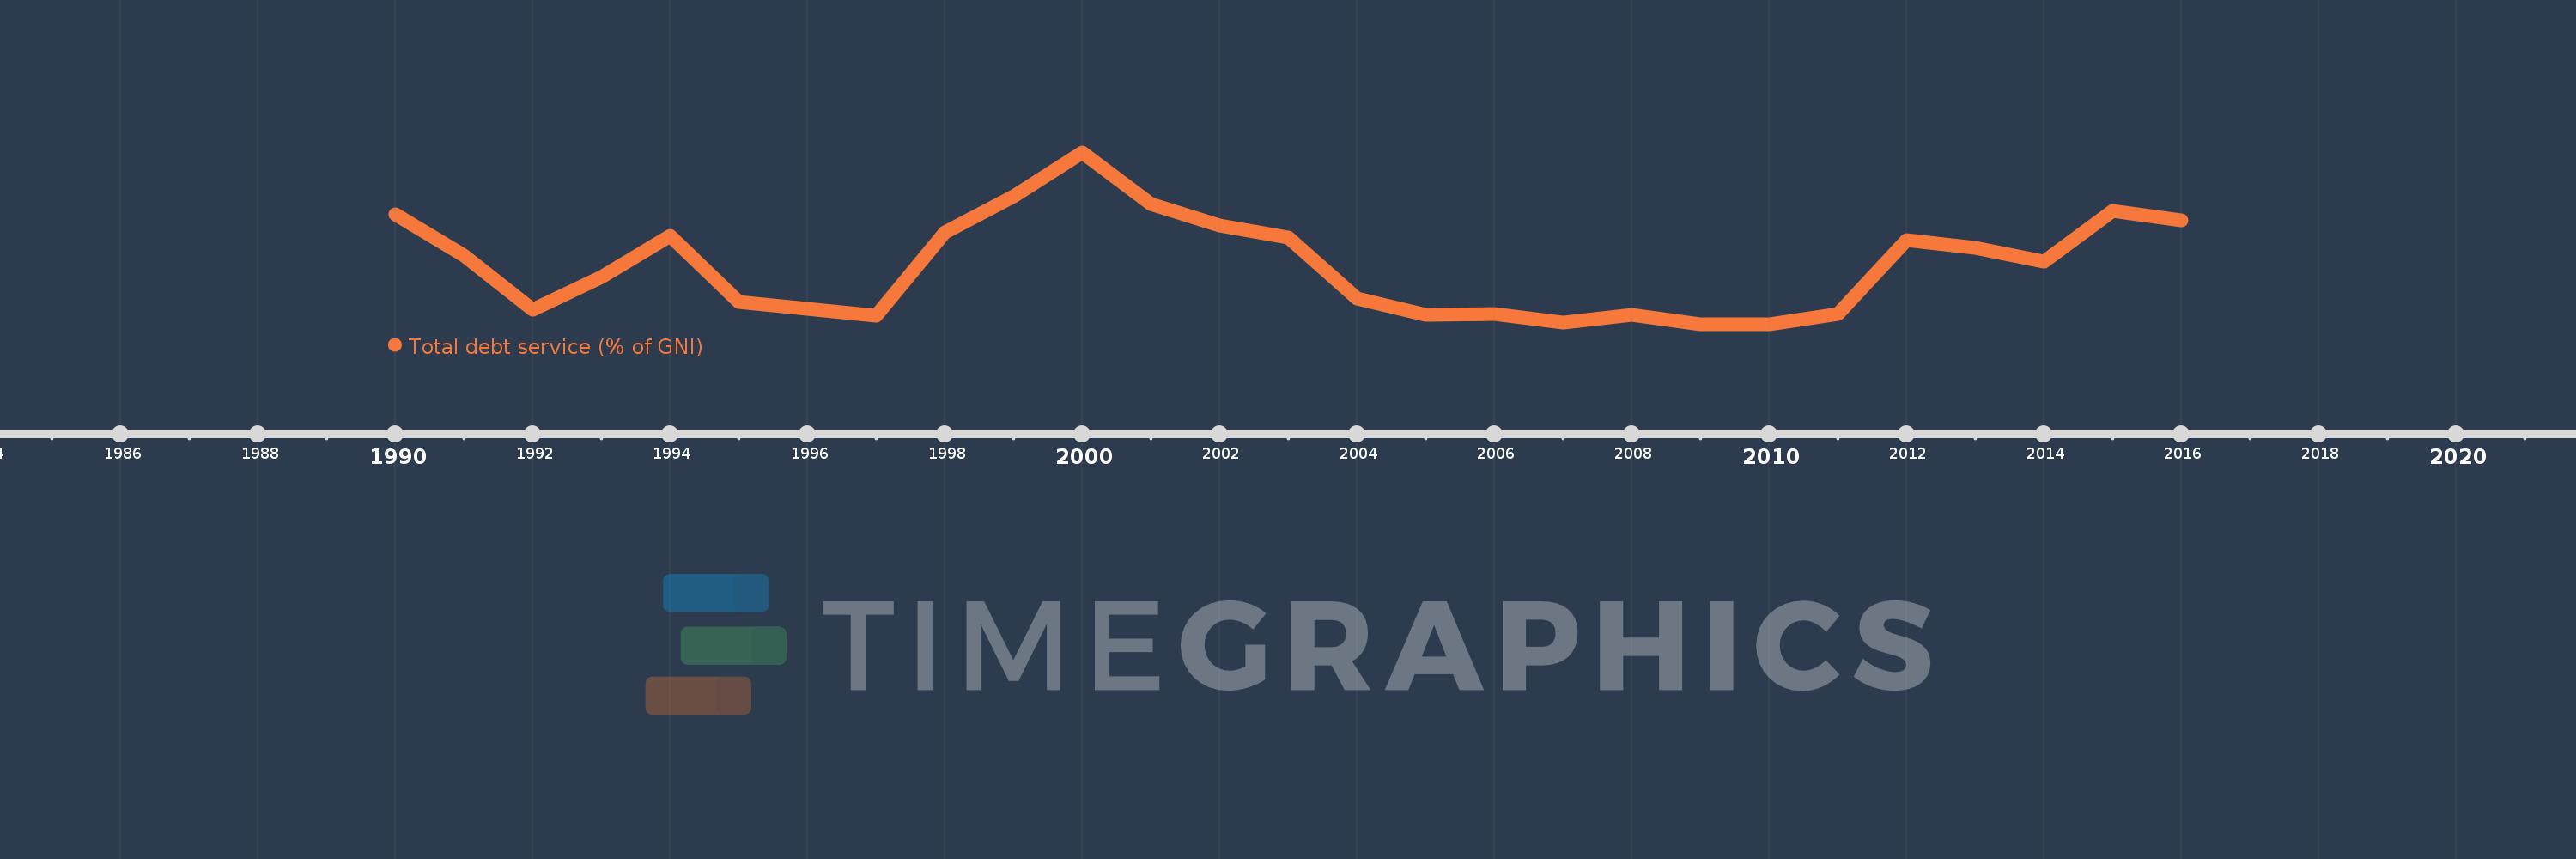
Cette échelle de temps montre un graphique de 1990 année à 2016 année Vietnam. Les données jusqu'à 1989 année ne sont pas présentés. Quantité d'observations actuelles selon dates: 27.

Source (désignation):

Les indicateurs du développement mondiale

Source (organisation):

World Bank, International Debt Statistics.

Catégories:

Economy & Growth, External Debt

Dernière mise à jour

23 avr. 2017

Les indicateurs de changement de valeurs selon les années

En moyenne:
2.666
Minimum:
1.463
1 janv. 2009
Maximum:
4.999
1 janv. 2000
Pour la date d''observation
Valeur
Changement absolu
Le changement par rapport à la valeur précédente
1 janv. 1990
3.717
+3.717
0.0%
1 janv. 1991
2.874
-0.843
-22.68%
1 janv. 1992
1.77
-1.103
-38.39%
1 janv. 1993
2.429
+0.658
37.19%
1 janv. 1994
3.289
+0.86
35.4%
1 janv. 1995
1.928
-1.361
-41.38%
1 janv. 1996
1.774
-0.154
-7.98%
1 janv. 1997
1.631
-0.143
-8.05%
1 janv. 1998
3.351
+1.719
105.4%
1 janv. 1999
4.102
+0.752
22.43%
1 janv. 2000
4.999
+0.897
21.87%
1 janv. 2001
3.935
-1.064
-21.29%
1 janv. 2002
3.494
-0.441
-11.2%
1 janv. 2003
3.239
-0.255
-7.29%
1 janv. 2004
1.989
-1.25
-38.59%
1 janv. 2005
1.657
-0.332
-16.7%
1 janv. 2006
1.671
+0.014
0.86%
1 janv. 2007
1.488
-0.183
-10.98%
1 janv. 2008
1.661
+0.173
11.6%
1 janv. 2009
1.463
-0.197
-11.87%
1 janv. 2010
1.466
+0.003
0.2%
1 janv. 2011
1.68
+0.213
14.55%
1 janv. 2012
3.186
+1.506
89.66%
1 janv. 2013
3.034
-0.151
-4.75%
1 janv. 2014
2.755
-0.279
-9.19%
1 janv. 2015
3.793
+1.037
37.64%
1 janv. 2016
3.607
-0.186
-4.91%

Classement des pays selon les statistiques actuelles par années